.svg)

Executive Summary:
Reefer markets in Q4 2025 are set to tighten as holiday produce, cross-border imports, storage crops, and weather risks converge. Capacity remains steady year-over-year, but USDA and DAT data show recurring pressure in California, Arizona, Texas, the Southeast, and the Pacific Northwest. Shippers should plan ahead by locking in coverage early in these hotspots to manage volatility and protect downstream lanes.
Key Q4 Market Shifts:
California Citrus, Arizona Leafy Greens, and Texas Imports
For four straight years, these regions have set the pace for Q4 refrigerated freight. Texas border crossings handle nearly one-third of U.S. produce truck movements, making them the single largest driver of demand. California citrus regularly tops 300k tons in Q4, pushing tightness into Midwest and Northeast lanes. Arizona volumes are smaller but dominated by leafy greens, creating predictable stress during the Salinas–Yuma transition. Together, these surges have tightened reefer capacity every Q4 since 2021 and are expected again in late 2025.
Holiday-Driven Commodities
Accounting for 30–35% of Q4 fresh produce shipments, potatoes, apples, and onions anchor national volumes, while the PNW remains a major regional hotspot. On top of this baseline, seasonal peaks in cranberries, sweet potatoes, and poultry have caused repeated shortages in Southeast and Midwest markets, especially NC sweet potato and Florida vegetable lanes. This layering effect shifts scarcity eastward each holiday season and is expected to reemerge in Q4 2025.
La Niña Watch: Freeze Risk
NOAA has issued a La Niña Watch, noting that “a brief period of La Niña conditions is favored in the fall and early winter 2025-26 before reverting to ENSO-neutral.” Even a short La Niña raises the risk of early freezes in Florida, Georgia, and California, threatening harvest timing and disrupting refrigerated freight flows.
National Market Overview:
DAT National Reefer Rates:
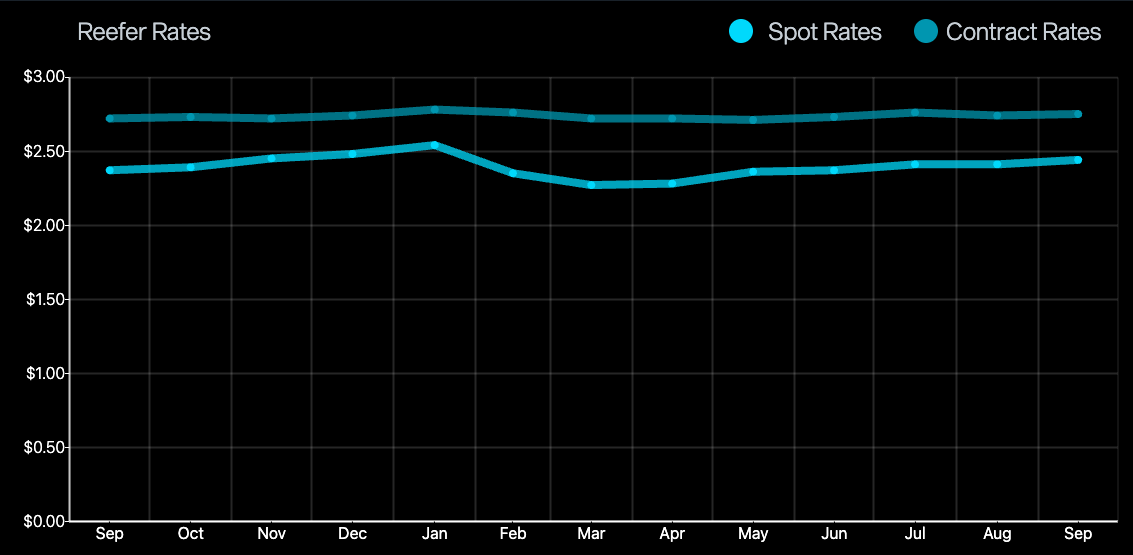
Spot rates softened in early 2024 before recovering midyear, while contract rates held steady. Looking ahead, reefer spot rates are expected to stay 5 to 7 percent above contracts, the widest spread among trailer types. This gap highlights how perishables volatility continues to push reefer pricing ahead of broader market trends.
DAT Reefer Load-to-Truck Ratio:

Reefer load-to-truck ratios in 2025 are trending well above 2023 and 2024, underscoring stronger demand and fewer available trucks across the year. This signals a tougher operating environment heading into Q4 compared with the last two years.
DAT Outbound Reefer Capacity (Sep 28th, 2025)
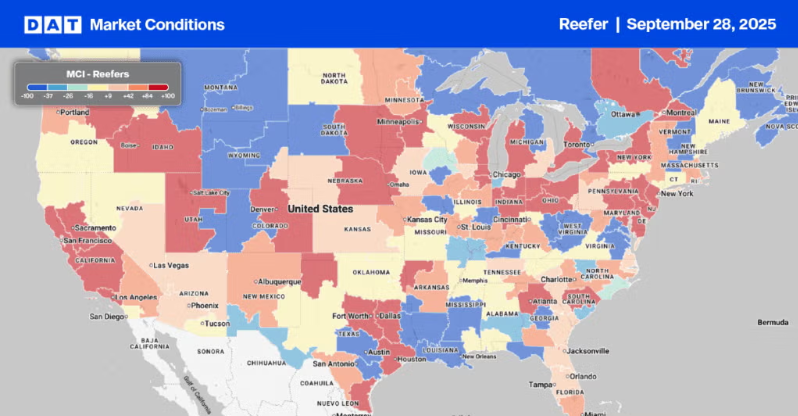
The map shows outbound reefer capacity tightening as expected heading into Q4, with pressure in California, the South Central, Upper Midwest, and Northeast, while Florida and Arizona begin tightening ahead of seasonal shifts.
EIA U.S. Diesel and Crude Oil Outlook:
.png)
The EIA projects retail diesel to hold near $3.50 per gallon into late 2025, with only slight year-over-year declines. Stable Brent crude prices and balanced margins suggest fuel surcharges will stay firm through the holiday shipping season.
Regional Hotspots & Commodity Drivers
California & Florida (Citrus)
Each Q4, citrus harvests out of Fresno, CA and Lakeland, FL put pressure on reefer lanes into Midwest and Northeast retail hubs. USDA AMS consistently reports seasonal tightness from both origins, and when early freezes strike, the two markets tighten in tandem, creating a two-coast squeeze that magnifies coverage challenges.
What this means: Shippers into markets like Chicago and New York should expect elevated volatility and budget for higher coverage costs.
Texas Border Crossings (Avocados & Tomatoes)
Texas ports averaged nearly one-third of U.S. Q4 produce volumes from 2021–2024, with avocados and tomatoes among the biggest contributors. Cross-border surges displace domestic trucks and raise rates into the Southeast.
What this means: Capacity gets siphoned away from Texas and neighboring markets, leaving fewer trucks for domestic produce and driving premiums in short-haul lanes.
Arizona/Yuma (Leafy Greens)
Leafy greens made up 80–90% of Arizona’s ~400k tons per Q4, concentrated during the Salinas-to-Yuma transition. Overlap with holiday demand compounds pressure into Texas and Midwest lanes.
What this means: Shippers dependent on fresh greens should secure reefer coverage early to avoid last-minute rate spikes.
Pacific Northwest (Potatoes & Onions)
Potatoes, apples, and onions represent 30–35% of Q4 produce shipments nationally, with the PNW alone shipping ~1.8–1.9M tons per quarter. USDA AMS availability ratings show the region consistently “tight,” reflecting its steady pull on reefer supply.
What this means: Even when other crops fluctuate, PNW storage crops guarantee a baseline of tightness that shippers must plan around.
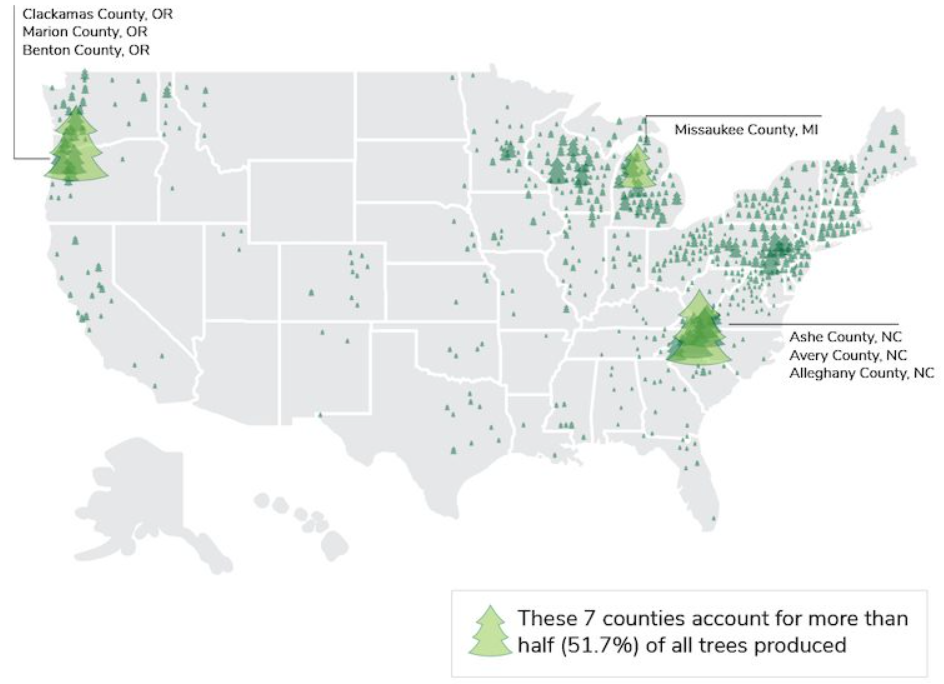
Pacific Northwest & North Carolina (Holiday Trees)
Holiday tree harvests in the Pacific Northwest and North Carolina/Virginia corridors compete with refrigerated produce and other outbound freight. This seasonal overlap drives rate pressure and tightens capacity across major lanes originating in these regions.
U.S. Christmas Tree Production by County (USDA Census of Agriculture)
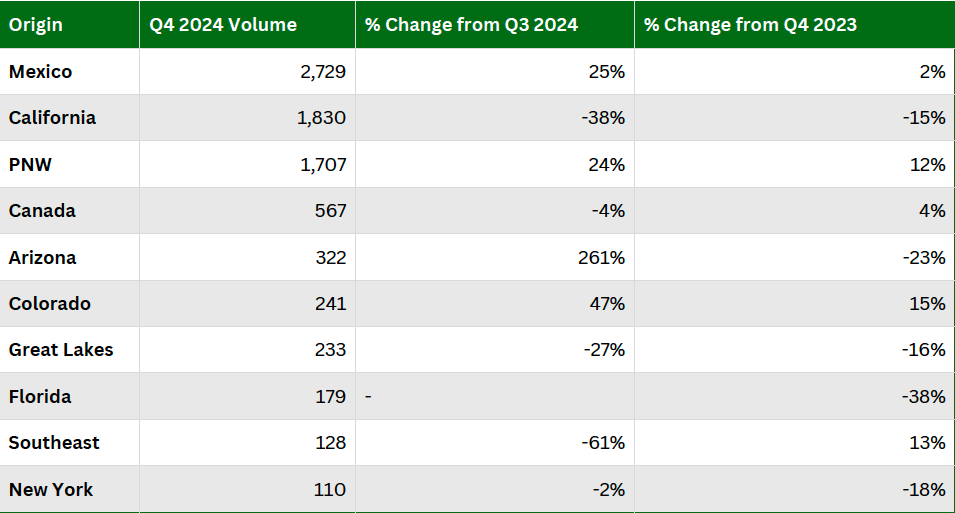
Reported Top 10 Regions (1,000 Tons)
This table shows Q4 2024 shipment volumes by region (1,000 tons) with quarter-over-quarter and year-over-year changes. Positive percentages show growth, negatives indicate declines.
Reported Top 10 Commodity Shipments (1,000 Tons)
This table ranks the top 10 produce commodities shipped in Q4 2024. Columns compare shipments against Q3 2024 and Q4 2023, with percent changes showing whether volumes rose or fell. The figures are in thousand tons, drawn from USDA AMS Specialty Crops data.

Shipper Takeaways:
- Lock in CA/FL citrus and AZ leafy green reefer coverage early.
- Account for TX import surges displacing domestic capacity.
- Prepare for freeze risk in FL/GA with active cold-chain monitoring.
- Leverage PNW storage crop steadiness to offset costs.
- Monitor diesel surcharges to protect delivered cost.
Key Dates for Reefer Planning:
- Diwali
- Demand window – October 18–25, 2025
- Thanksgiving
- Demand window – November 10–23, 2025
- Black Friday / Cyber Monday
- Demand window – November 28–December 2, 2025
- Christmas
- Demand window – December 8–19, 2025
- Reduced pickups – December 24–26, 2025 (supplier/carrier holiday schedules)
- New Year’s
- Year-end closures & reefer repositioning – December 31, 2025
- Post-holiday recovery – January 1–15, 2026
Lane Collaboration Opportunities:
Certain regions create recurring challenges each Q4, not because of lack of freight, but because of seasonal imbalances and weak backhaul options. These are areas where partnership matters most, and where working together can create win-win outcomes for both shippers and carriers.
Southern California:
As Salinas winds down and Yuma ramps up, outbound coverage becomes thin and repositioning grows costly. By aligning with shippers moving northbound or eastbound freight during this period, we can reduce deadhead and keep capacity available.
Colorado:
Inbound opportunities are strong, but outbound coverage is limited. Collaborating with shippers who have Midwest or Southwest freight helps close this gap and reduces inefficiency for all parties.
Florida:
Freight into Florida is abundant, but return loads are harder to secure. Partnering on outbound produce or retail freight creates balanced lanes that benefit both shippers and carriers.
Idaho:
Potatoes and onions provide strong outbound volume, but inbound is weak. Working together with shippers in nearby states can ensure reliable outbound service.
Midwest:
Inbound lanes from the West are high paying, but outbound often erodes margins. Shippers with Midwest-to-West or Midwest-to-South freight can help balance these flows and ensure steadier coverage.
If you’re moving freight in or out of these regions, let’s work together to build a partnership that creates value on both sides. Reach out to sales@freshfreight.com to start the conversation.
Fresh Freight Insights:
Fresh Freight is built for food and perishable freight. Our network is centered on refrigerated markets, giving us density where shippers need it most during Q4’s volatile season.
Specialization:
We don’t split focus, refrigerated freight is the core of our business.
Lane density: California, Arizona, and Southeast reefer corridors are supported by established carrier networks, ensuring faster, more reliable coverage.
Temperature control expertise:
Every shipment is managed with precision to maintain quality and reduce claims risk.
Market positioning:
By anticipating holiday produce surges and winter weather disruptions, we keep shippers ahead of tightening markets.
Sources:
USDA AMS — Refrigerated Truck Quarterly Reports, Q4 2021–2024 (U.S. Fresh Fruit and Vegetable Truck Availability, Commodity and Regional Shipment Volumes).
DAT Trendlines — Reefer Load-to-Truck Ratios, Spot vs. Contract Rates.
EIA (U.S. Energy Information Administration) — Short-Term Energy Outlook (August 2025), Diesel price forecasts.
NOAA Climate Prediction Center. ENSO Diagnostic Discussion. August 14, 2025. National Oceanic and Atmospheric Administration.