.svg)

Executive Summary:
Historically, Q2 is one of the more manageable quarters for reefer capacity. Produce volume is strong but predictable, and the seasonal patterns are well-established. That general picture still holds in 2026, but the operating environment is different in a few ways worth planning around.
- The Macro Backdrop: Transportation capacity is contracting and prices are accelerating. Equipment orders remain replacement-driven with no meaningful capacity growth expected before late 2026.
- Fuel Surcharges: California refinery closures and Middle East conflict are pushing diesel prices higher. Expect index-linked surcharges to climb through Q2.
- The Rate Environment: Spot has crossed above contract for the first time in over a year, and load-to-truck ratios are running higher than this point in 2025 and 2024. Contracted capacity is now the more cost-efficient option.
- Enforcement and Compliance: CVSA Roadcheck runs May 12-14, and ongoing removal of non-domiciled CDLs have gradually reduced the available driver pool, particularly for long-haul team moves. Neither is new, but both carry more weight in a tighter market.
- The Produce Calendar: The Yuma to Salinas transition, the Southeast handoff, the melon surge, and West Coast cherry season follow predictable patterns.
Q2 Produce Volume and Reefer Capacity Overview: Interactive Charts
Regardless of the type of perishables you are shipping, produce movements drive reefer capacity and pricing within key regions. Analyzing these patterns provides a strong general indicator of market conditions. Use the interactive charts to explore how your region or commodity is affected.
*Data for all three charts is sourced from the U.S. Department of Agriculture Agricultural Marketing Service (USDA AMS). Values shown represent a four-year average of Q2 data to establish a seasonal baseline for regional volume, commodity volume, and truck availability. These visuals reflect typical market conditions. Actual volumes and capacity may vary based on weather, demand shifts, and logistical disruptions.*
7 Shifts to Watch in Q2 2026
1. CVSA International Roadcheck (May 12th to 14th)
From May 12th to 14th, the CVSA International Roadcheck will introduce predictable friction into the national refrigerated network [1]. During this 72-hour blitz, service failures are driven by enforcement rather than demand, meaning even historically stable lanes are exposed to disruption.
- Targeted Focus: Enforcement will aggressively target cargo securement and electronic logging device manipulation.
- Capacity Squeeze: Expect a temporary reduction in flexible spot capacity. Many independent operators and fleets will idle their equipment to avoid inspection risks and potential fines.
- The 2025 Blitz Fallout: During last year's event, inspectors conducted over 56,000 inspections and placed 10,148 vehicles and 3,342 drivers out of service [2]. The result is an out-of-service spike that immediately pulls thousands of trucks from the active routing pool, creating sudden capacity gaps and pushing spot rates higher across the network.
Takeaway (mid-May): Keep your routing plan tight so freight doesn’t get stranded due to noncompliant carriers. Avoid last minute swaps, and keep docks inspection ready with proper securement, accurate paperwork, and clean timestamps so drivers avoid preventable violations.

2. Southeast Produce Handoff: Florida to Georgia (April - May)
As Q2 moves forward, East Coast produce volume shifts from South Florida up into Central Florida and Southern Georgia. That handoff tightens capacity and makes coverage less predictable as carriers chase premium freight tied to seasonal surges.
- The Georgia Ramp: Winter Storm Fern-driven crop shortfalls in Florida will accelerate carrier repositioning into Georgia as early as mid-April. That shift directly overlaps with Georgia’s peak season for early stone fruit and the Vidalia onion harvest, which spans 14,000+ acres and accounts for roughly 40 percent of the national spring onion volume [3]. Expect a compressed outbound schedule, higher rates, and higher tender rejections in the Southeast as massive volume concentrates in short time-frame.
- Inbound Rate Softening: Rates into the Southeast can soften as carriers discount inbound moves from the Midwest and Northeast to reposition for higher-paying outbound loads. This can create a “cheap in, expensive out” pattern for shippers with Southeast DCs.
Takeaway: Run a two-direction plan. Protect outbound Southeast service with committed carriers or targeted premiums on your most service-sensitive lanes, then actively shop inbound freight into the region to capture repositioning discounts while they exist.
3. Melon Surge: Florida, Georgia,Texas, Arizona, California (Late May)
By late May, the watermelon harvest becomes the highest-moving produce commodity in the country, placing pressure on regional freight markets across the Southern belt.
- Volume Impact: In Q2 2025, watermelons accounted for 12% of all reported U.S. produce shipments (1.09 million tons), representing a staggering 560% volume explosion compared to the previous quarter [4].
- Regional Concentration: The strain on trucks is severe and localized. Last year in Q2, watermelons comprised 41 percent of outbound produce volume in Florida (323,000 tons) and 35 percent in the broader Southeast (161,000 tons) [4]. Additionally, 423,000 tons crossed from Mexico, intensifying trailer competition in Texas and Arizona border markets [4].
- Complexity & Friction: Melon loads frequently require multiple field pickups and longer dwell times, burning through hours-of-service and reducing trailer turns. Because heavy payloads and rough field conditions increase equipment wear, premium carriers generally avoid this freight entirely. This creates a "capacity cascade,” standard carriers are absorbed by the melon fields, forcing all other regional shippers to compete for the remaining pool of carriers.
Takeaway: Standard routing guides will fail as general carriers abandon paper rates for melon premiums in the southern belt. Protect your freight by securing committed capacity with providers that understand produce and food, leveraging their dedicated networks to insulate your supply chain. For any uncontracted volume, limit spot premiums to critical lanes where service failures carry severe downstream costs.

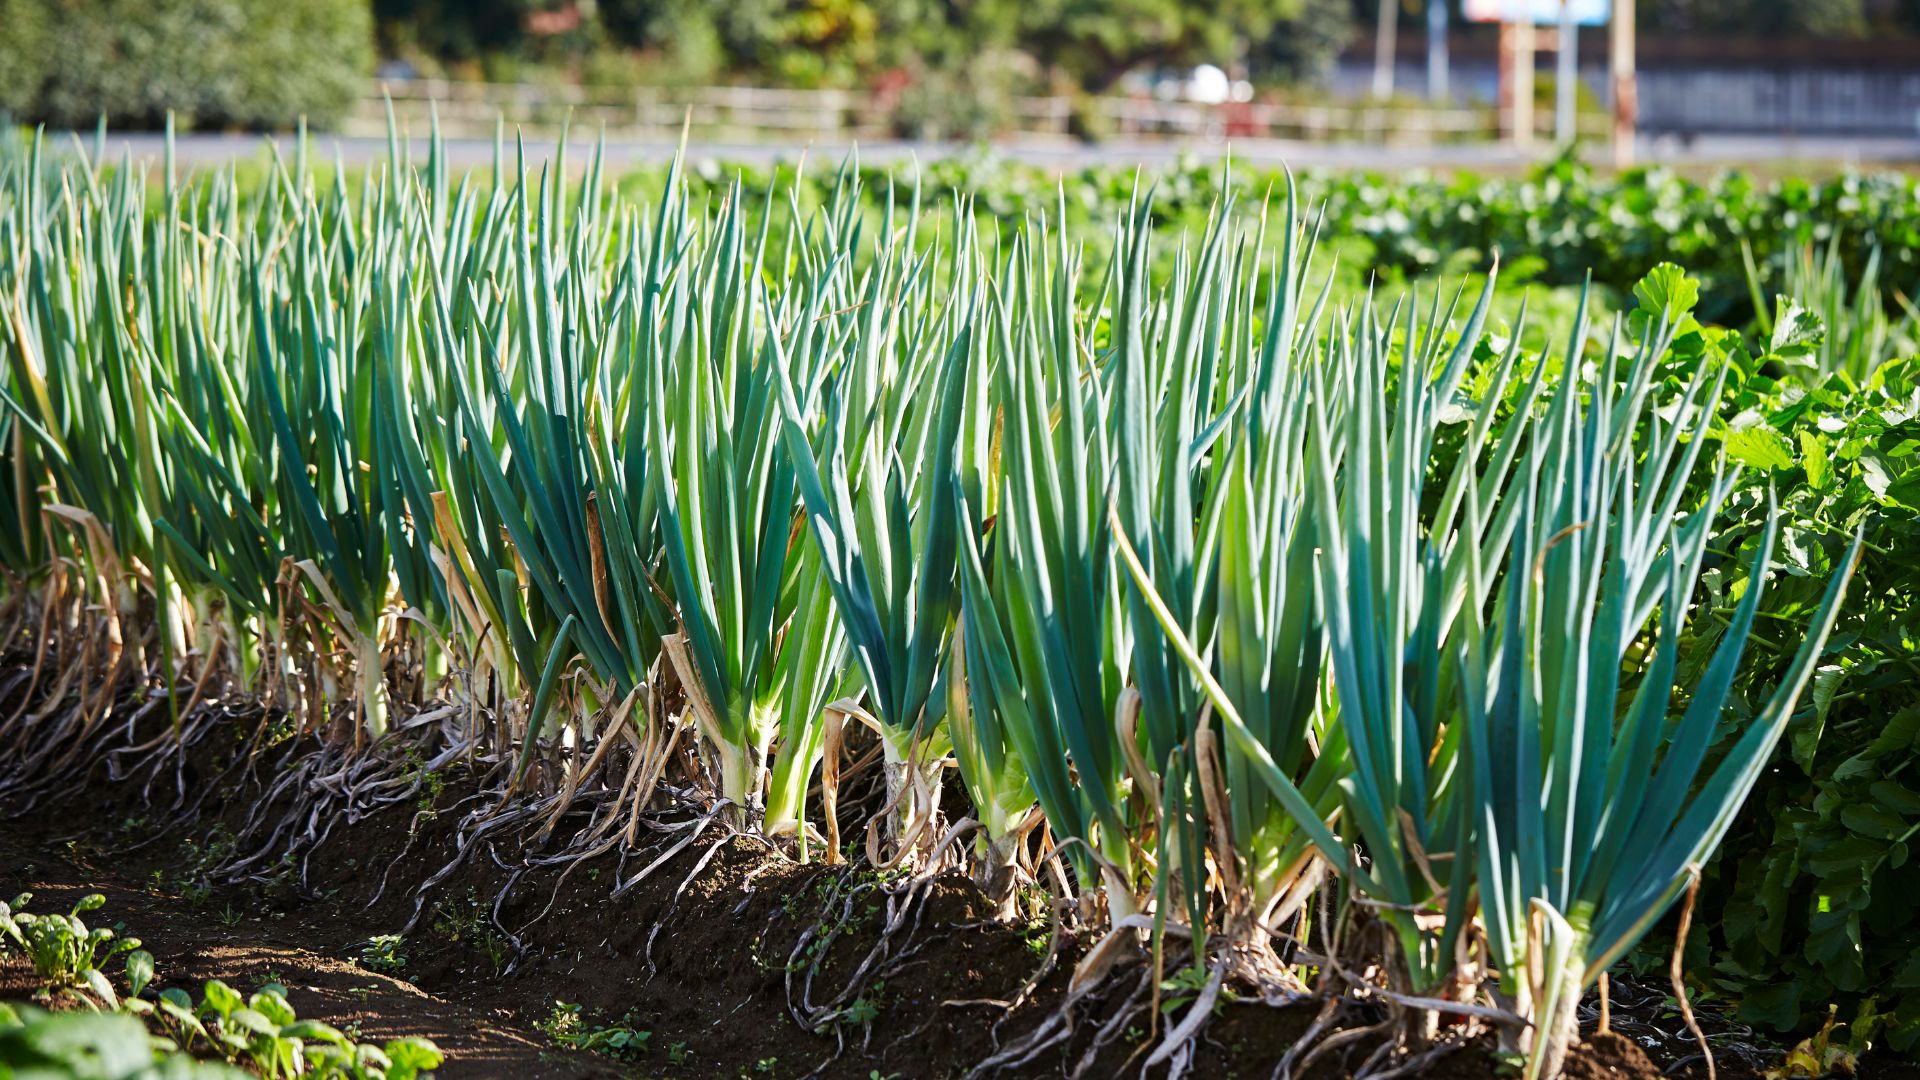
4. West Coast Leafy Greens Shift: Yuma to Salinas (Mid-April)
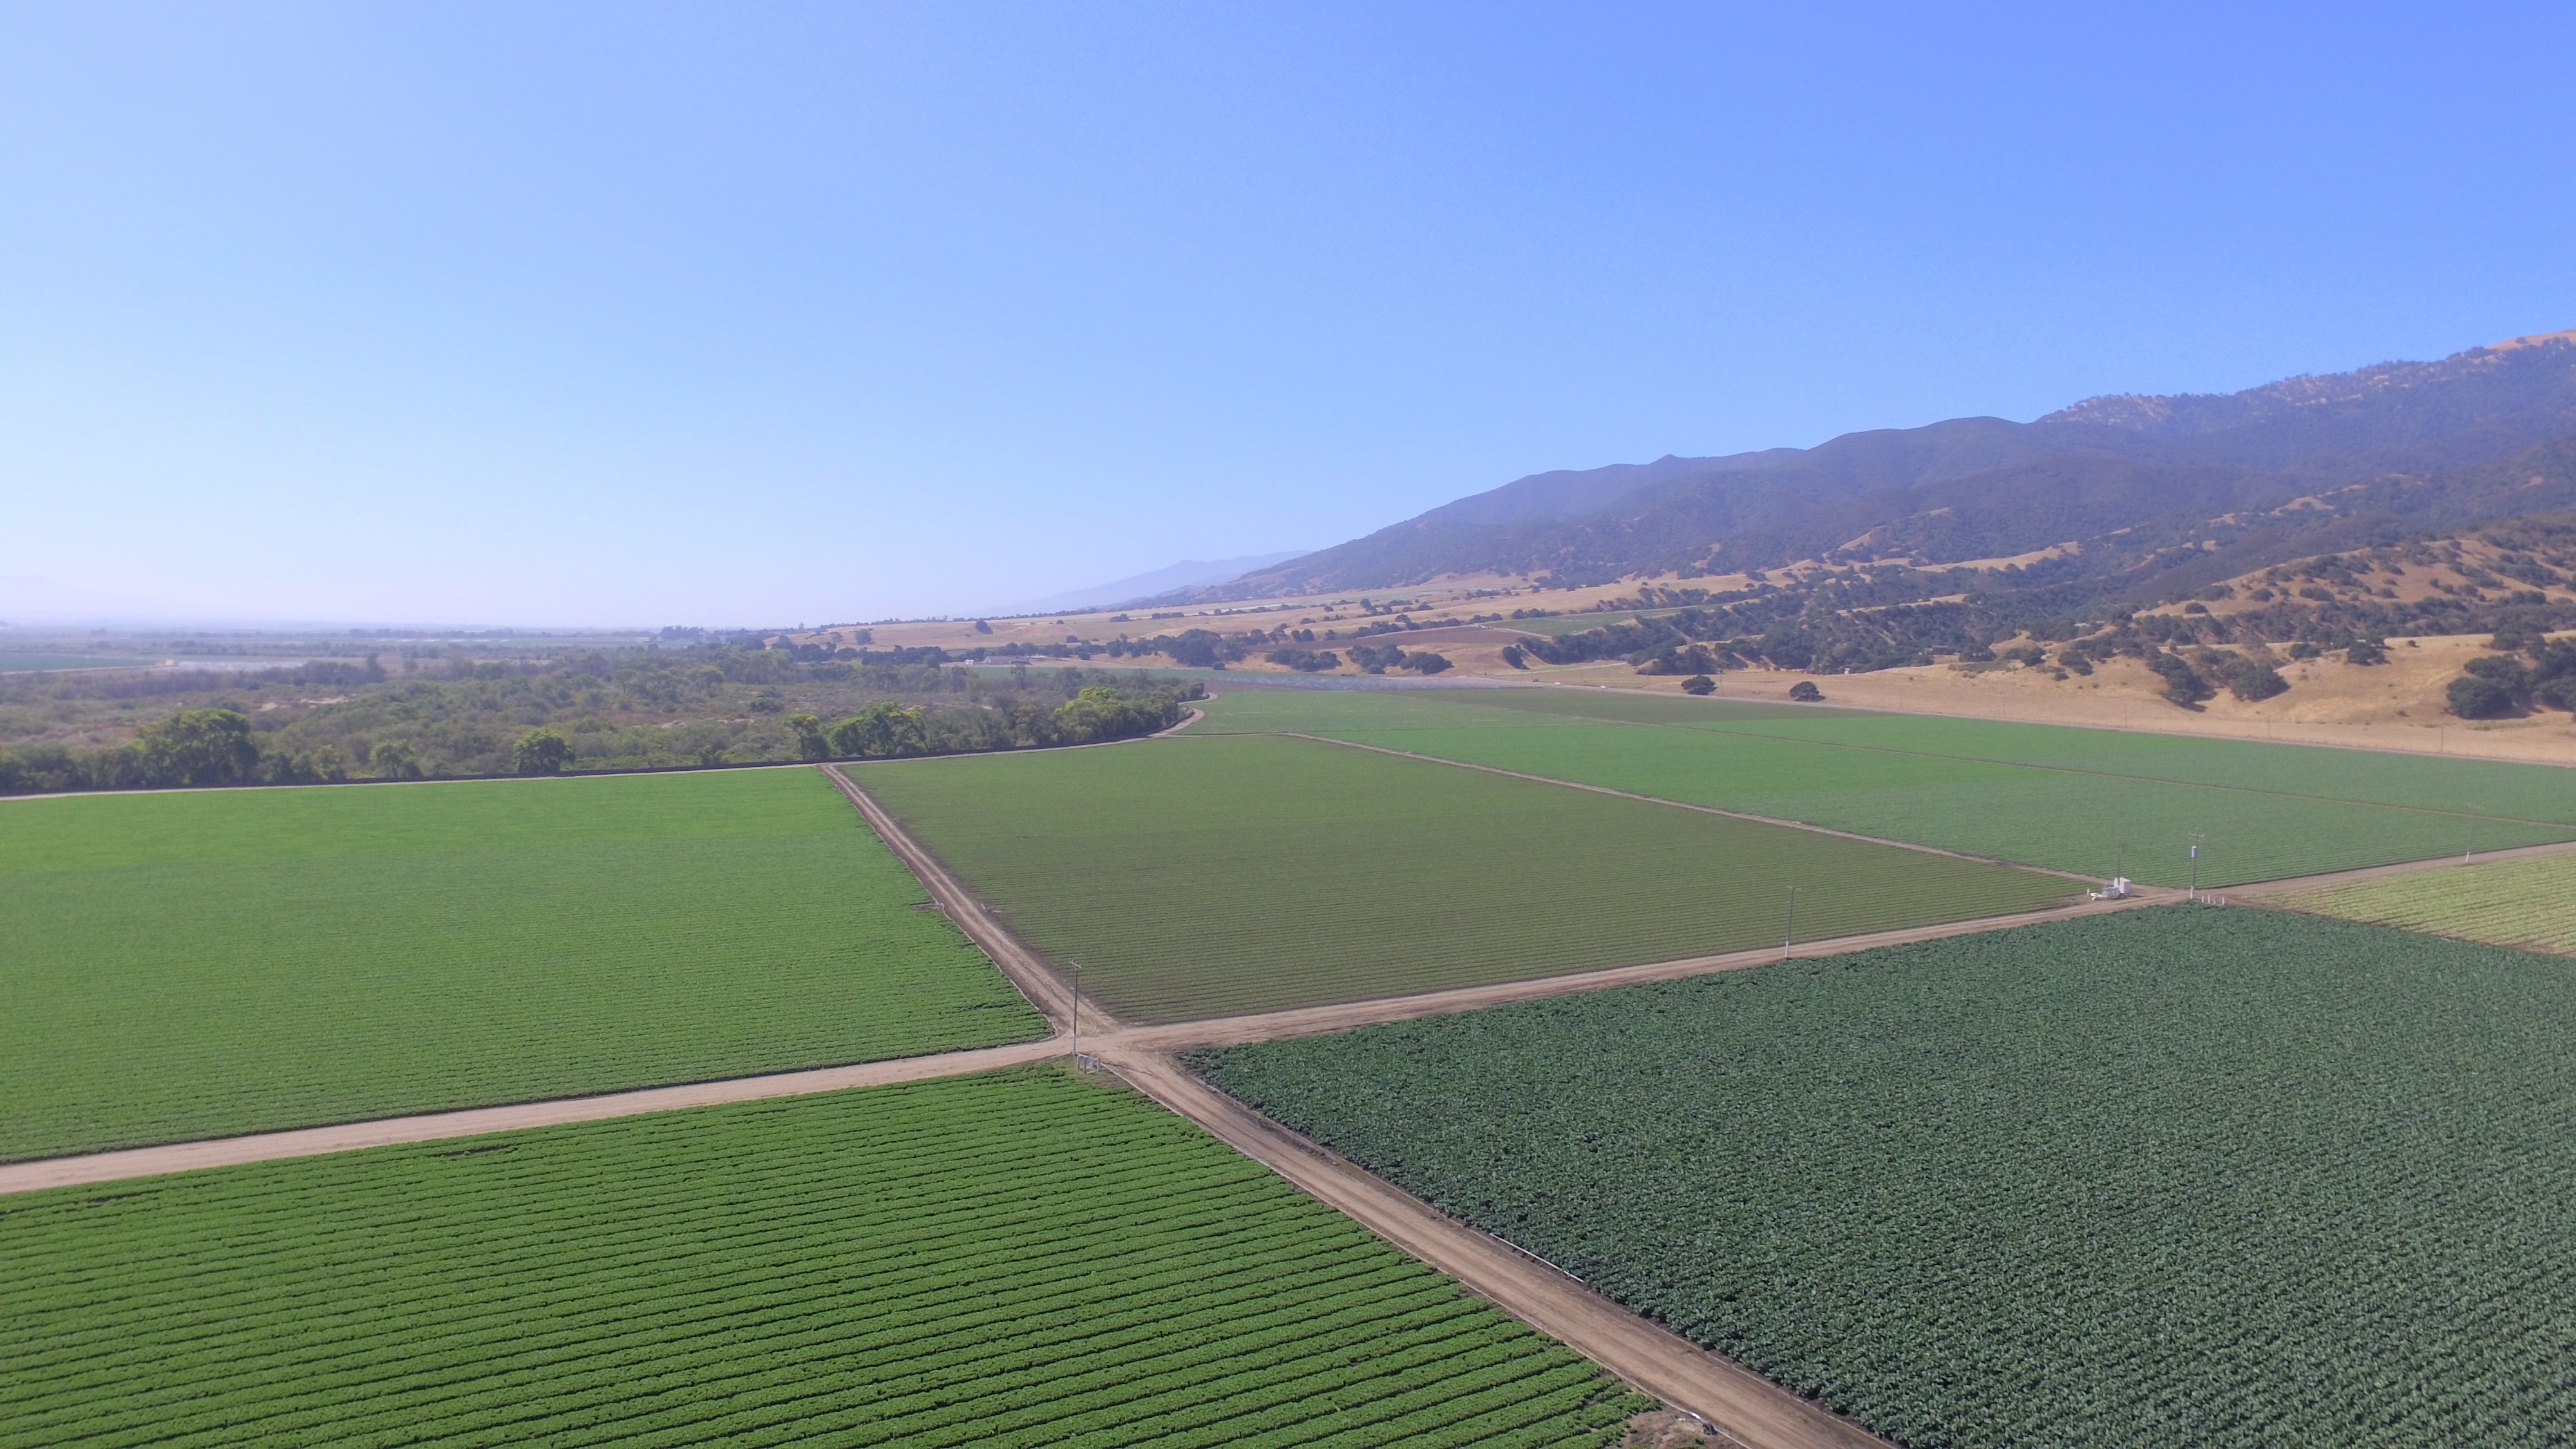
Between April 13th at the earliest and April 27th at the latest, the West Coast will undergo a major reset as produce volume shifts out of Yuma and the Imperial Valley and into California’s Central Coast and Salinas Valley, forcing reefer networks to reposition quickly.
- The Salinas Capacity Pull: The scale of this transition is massive. In Q2 2025, California accounted for 20 percent of all U.S. produce shipments, moving 1.82 million tons [4]. The shift into Salinas drives extreme quarter-over-quarter volume explosions, including a 458% spike in iceberg lettuce (232,000 tons) and a 316% spike in romaine (217,000 tons) [4]. These products pull reefer equipment from surrounding markets, creating immediate coverage gaps for standard reefer shippers on nearby lanes.
- Equipment Repositioning Friction: Deadhead costs rise as carriers push trucks into Central and Northern California, reducing flexibility and lifting spot rates short term.
- Weather-Driven Volatility (Active Risk): This year’s transition carries lingering weather risk. Recent storms and localized flooding near Salinas have already disrupted field conditions, which could later compress harvest schedules. For shippers, that means harvests may arrive in bursts, concentrating pickups and tightening reefer availability quickly during the transition.
Takeaway: Plan for an equipment positioning gap in Northern and Central California during these transition weeks in late April. Win by extending your lead times: tender freight five to seven days out where possible, and budget for targeted repositioning costs on lanes where carriers must move equipment ahead of the ramp.
5. West Coast Cherries (May-June)
Cherry season is a predictable West Coast handoff. It starts in California in mid-May, typically peaks in California by late May, then shifts north, with late June marking the start of Pacific Northwest production in Washington, Oregon, and Idaho [5] [6]. The dynamic is urgency more than volume, because tight pickup windows and rapid cooling requirements reward carriers that can execute cleanly.
- Extreme urgency: The PNW produced 23,617,800 (20-lb) cartons in 2025, representing 70% of the fresh U.S. sweet cherry crop [6]. Cherries are extremely sensitive and have a 7–14 day shelf life even under cold storage. Postharvest guidance emphasizes speed: cherries should be cooled to below 41°F within ~4 hours of harvest to protect quality [7].
- Premium capacity pull: Industry reporting pegs U.S. sweet cherry movements at roughly 23,000 refrigerated truckloads, with peak activity centered in the Pacific Northwest in June–July [8]. That concentration of time-sensitive freight is why cherry weeks reliably pull higher-service capacity first and lift local spot pricing.
Takeaway: If you move temperature-controlled freight out of California (mid-May to early June) or WA/OR/ID (late June start), plan for tighter pickup windows as reefer capacity shifts into West Coast produce and carriers run tighter schedules. Secure core coverage early, keep docks on-time, and have pre-approved surge options ready so you are not forced into last-minute carrier changes when the market firms up.

6. Holiday demand pulses: Easter, Mother’s Day, Memorial Day
In Q2, holiday weeks get expensive for one main reason: lead times compress. As tenders slide inside 72 hours, carriers stop protecting the routing guide and start prioritizing the cleanest, fastest-turn freight, which raises premiums unless coverage is staged early.
- Easter: Retail pull-forward tightens receiving windows and forces higher-frequency replenishment into metro DCs, where missed appointments can snowball into multi-day delays.
- Mother’s Day: A short-notice foodservice surge in early May compresses pickup windows and adds rate pressure, especially alongside Southeast produce ramps.
- Memorial Day: The summer kickoff concentrates promo and protein moves into fewer shipping days, increasing rejection risk and pushing more freight to spot.
Takeaway: Treat holiday weeks as schedule-compression events. Pull tenders forward, protect appointments, and pre-plan surge coverage on your most critical lanes to avoid last-minute spot decisions.
7. Middle East Trickle-Down: Fuel Price Outlook
The Middle East conflict has sent national diesel surging $0.86/gallon in a single week, but the real pain is concentrated in California, where Q2 produce volume is heaviest.
- National vs. California: The EIA forecasts retail diesel at $4.54/gallon nationally in Q2 2026, up 28% year-over-year [9]. California diesel hit $5.87/gallon as of March 9, roughly $1.27 above the national average. Every California-origin reefer load carries that premium in its cost structure.
- Structural, Not Just Crude: Phillips 66 closed its 139,000 b/d LA refinery in late 2025. Valero's 145,000 b/d Benicia facility shuts down April 2026, right as Q2 produce ramps. That removes 17.5% of California's refining capacity [10]. The EIA has warned this will have an "outsized" regional impact because the West Coast cannot easily access supply from other U.S. refining hubs [11]. Arizona and Nevada face spillover effects.
- The Lag: Fuel surcharge schedules typically trail actual diesel prices by 1-2 weeks. Q2 surcharges will climb through April and May even if crude softens. Shippers budgeting off Q1 fuel costs will be caught short.
Takeaway: Do not build Q2 budgets off Q1 fuel costs. California-origin freight carries a structurally higher fuel premium than the national average, and that gap is widening. The EIA's price projections reflect a modest approach and assume the Strait of Hormuz reopens. If disruptions persist, these numbers get worse.

Macro Overview:
Across rates, capacity, equipment, and compliance, every major indicator heading into Q2 is pointing in the same direction: a tighter, more expensive reefer market with fewer ways to absorb cost on the spot side.
National Overview:
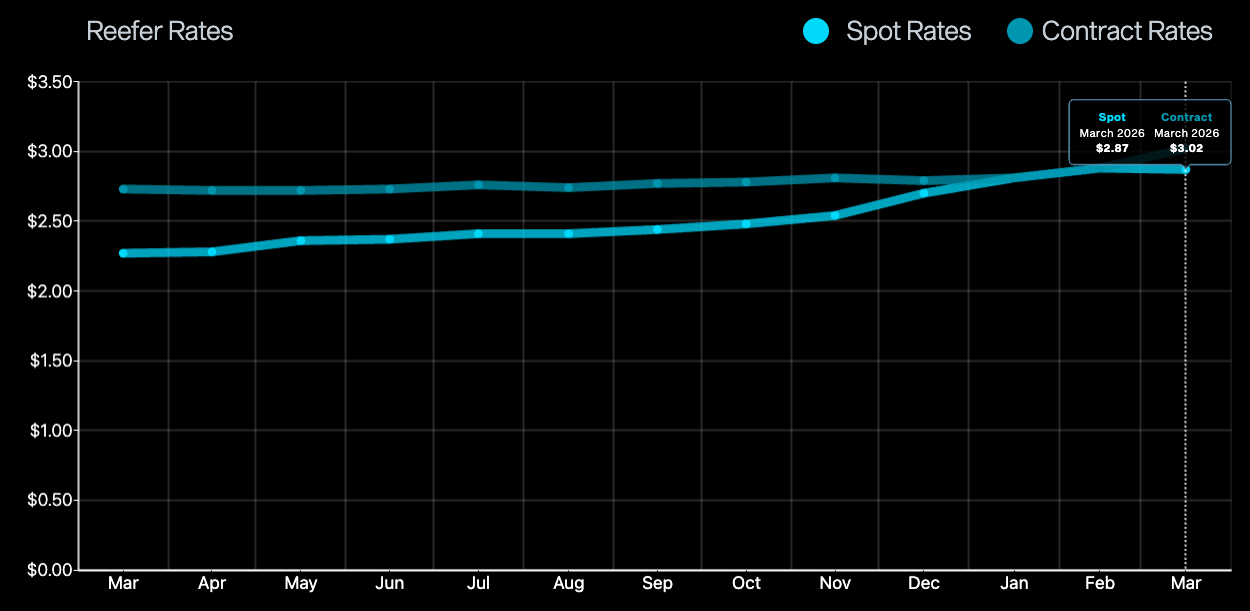
Takeaway: Reefer spot and contract rates converged in mid-January, and spot has since pushed above contract — a reversal that makes contracted capacity the clearest path to cost savings heading into Q2. Shippers still relying on the spot market are now paying a premium for volatility.
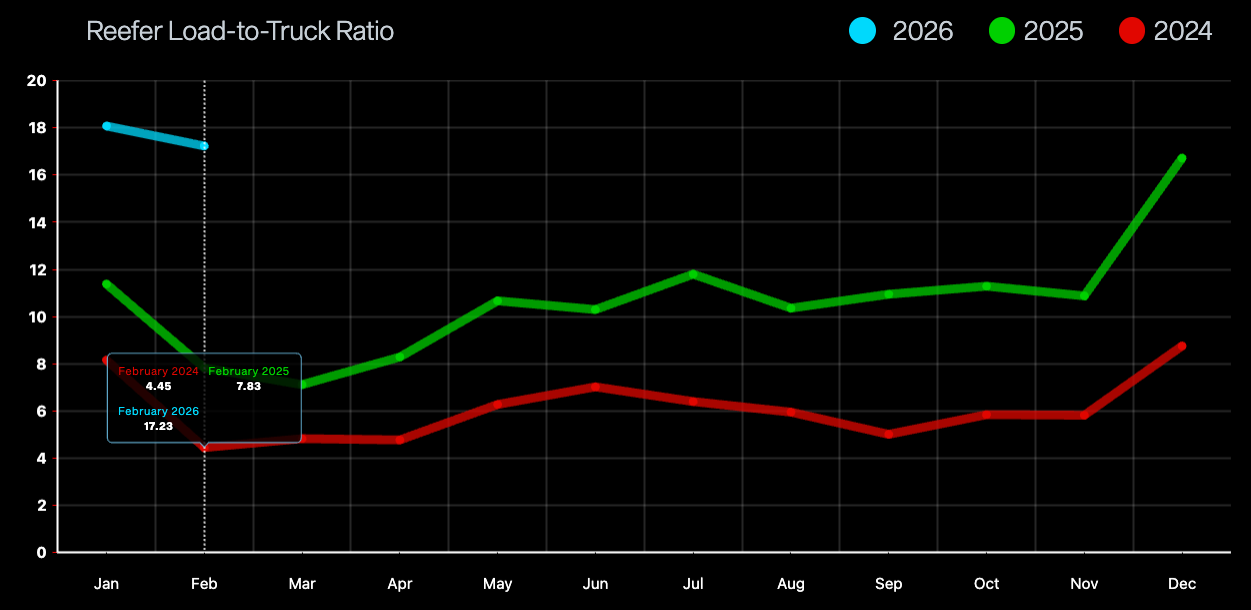
Takeaway: Reefer load-to-truck ratios are opening 2026 at roughly 18, well above where 2025 and 2024 started, meaning there are significantly more loads competing for every available truck than in either of the last two years. If that trend holds as the year progresses, finding reliable reefer capacity on the spot market will only get harder and more expensive.
Equipment and Supply Indicators to Monitor:
Early 2026 equipment and freight data suggests fleets are still buying cautiously, but rates have a firmer floor because usable capacity is tightening as the driver pool shrinks, even while overall demand remains uneven
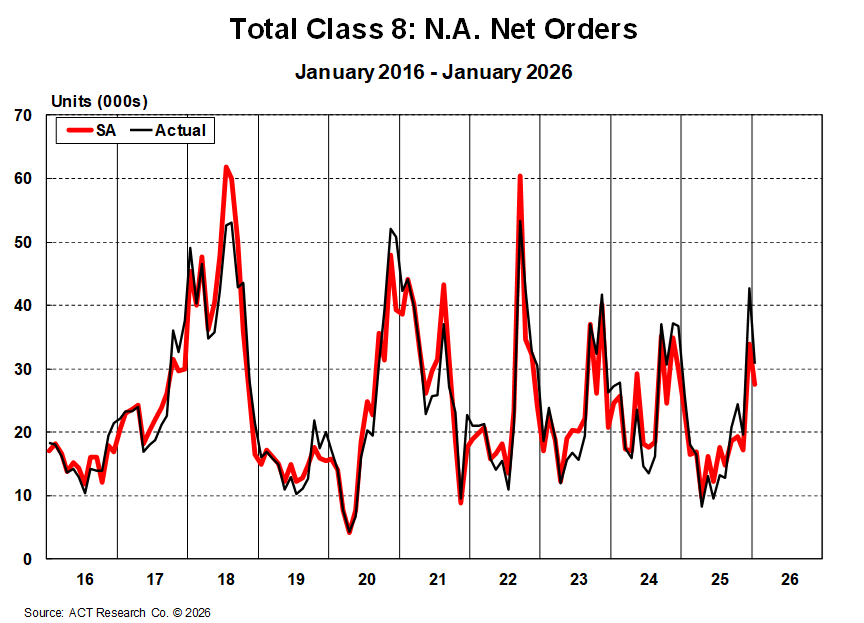
ACT Class 8 orders (Feb 2026): After December's surge to ~42,700 units, January moderated to ~30,800 but remains well above year-ago levels. Fleets are still buying to replace aging equipment, not to expand, with §232 tariffs, high financing costs, and tight margins keeping purchasing decisions selective. A broader capacity growth cycle is unlikely before late 2026 at the earliest [12].
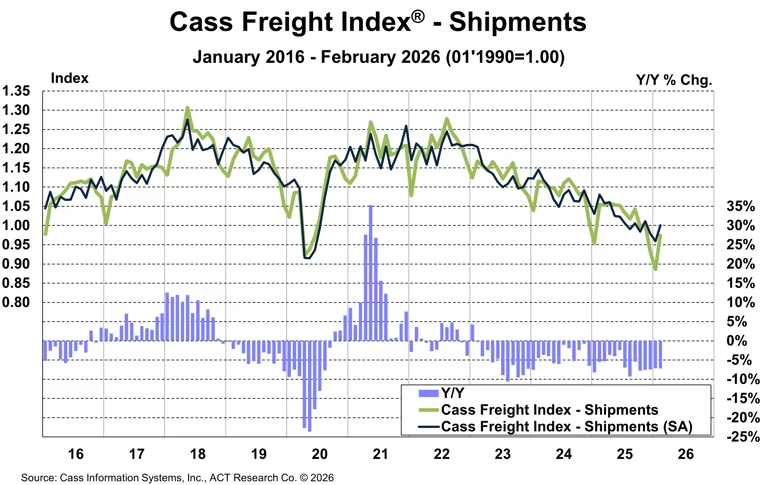
Cass Transportation Index (Feb 2026): Cass is still showing a split market: shipments fell again in February (Index 0.978, -7.2% y/y, +10.4% m/m), but truckload linehaul pricing continued rising (Index 146.3, +2.2% y/y, +0.2% m/m). Supply constraints, not just weather but equipment and increasingly drivers, are keeping rates firm even without a broad volume rebound [13].
LMI Index (February 2026)
- The LMI came in at 61.5, its fastest expansion reading in a year, with transportation capacity contracting sharply to 41.0 and transportation prices accelerating to 76.7 [14].
Takeaway: When capacity contracts this fast while prices push higher, rate increases follow. For reefer shippers heading into Q2 produce season, this is a direct warning that the cost of relying on the spot market is going up, and contracted capacity is the most reliable hedge against it.
Team Capacity Under Compliance Pressure
- ELP enforcement tightened: Stricter enforcement of English Language Proficiency standards increased Out-of-Service risk at roadside inspections [15].
- Non-domiciled eligibility narrowed: FMCSA's non-domiciled CDL interim rule limited eligibility to specific visa categories, reducing the available driver pool for long-haul teams. Expanded enforcement efforts raised the likelihood of audits and deportations, leading some drivers to leave the market rather than risk enforcement action [16].
- California Impact: The Federal Motor Carrier Safety Administration compelled California's Department of Motor Vehicles to cancel approximately 13,000 non-domiciled commercial driver's licenses in early 2026, immediately removing these drivers from eligibility to operate commercial vehicles in interstate commerce [17].
Fresh Freight Lane Collaboration Opportunities:
- Our origin footprint is especially dense across key produce regions: California (Salinas, Central Valley, desert), Arizona, the Pacific Northwest, and Texas, giving shippers strong coverage out of the fields and allowing us to service those lanes with ease through an established carrier network.
- If you are shipping outbound from Colorado, Atlanta and the broader Southeast, Florida, South Carolina, Washington / Northern Virginia, or Philadelphia, our network alignment in these markets creates cost-efficient outbound opportunities and reliable backhaul capacity to growing regions.
To plug your lanes into our network or request a quote, reach out to sales@freshfreight.com.
Fresh Freight Origin Heatmap (Last 90 Days):
.png)
Fresh Freight Destination Heatmap (Last 90 Days):
.png)
Sources:
- Commercial Vehicle Safety Alliance. (2026, February 12). CVSA's International Roadcheck scheduled for May 12-14.
https://cvsa.org/news/2026-roadcheck/ - Commercial Vehicle Safety Alliance. (2025, October 7). CVSA releases 2025 International Roadcheck results.
https://cvsa.org/news/2025-roadcheck-results/ - Explore Georgia. 10 Things You Didn't Know About Vidalia Onions.
https://exploregeorgia.org/blog/10-things-you-didnt-know-about-vidalia-onions - U.S. Department of Agriculture, Agricultural Marketing Service. (2025). Refrigerated truck quarterly: 2nd quarter 2025 (RT Q2 2025).
https://www.ams.usda.gov/sites/default/files/media/RTQ2ndQuarter2025.pdf - California Cherry Board. (n.d.). About.
https://calcherry.com/about - Northwest Horticultural Council. (2025). Cherry fact sheet.
https://nwhort.org/industry-facts/cherry-fact-sheet/ - Washington State University Tree Fruit Research & Extension Center. (n.d.). Shipping (postharvest). https://treefruit.wsu.edu/postharvest/shipping/
- DAT Freight & Analytics. (n.d.). Reefer report: The sweetest of seasons has arrived.
https://www.dat.com/blog/reefer-report-the-sweetest-of-seasons-has-arrived - U.S. Energy Information Administration. (2026, March 10). Short-term energy outlook.
https://www.eia.gov/outlooks/steo/ - Breakthrough Fuel. (2025, October 28). How to navigate the impact of closing oil refineries in California.
https://www.breakthroughfuel.com/blog/how-to-navigate-the-impact-of-closing-oil-refineries-in-california/ - U.S. Energy Information Administration. (2025, July 9). Refinery closures present risk for higher gasoline prices on the West Coast. https://www.eia.gov/todayinenergy/detail.php?id=65704
- ACT Research. (n.d.). Class 8 truck orders.
https://www.actresearch.net/resources/data-tracking/class-8-truck-orders - Cass Information Systems. (2026, March 13). Cass Transportation Index report: February 2026. https://www.cassinfo.com/freight-audit-payment/cass-transportation-indexes/february-2026
- Logistics Managers’ Index. (2026, March 3). February 2026 Logistics Managers’ Index.
https://www.the-lmi.com/february-2026-logistics-managers-index.html - Executive Office of the President. (2025, May 2). Enforcing commonsense rules of the road for America’s truck drivers (Executive Order14286). Federal Register.
https://www.federalregister.gov/documents/2025/05/02/2025-07786/enforcing-commonsense-rules-of-the-road-for-americas-truck-drivers - Federal Motor Carrier Safety Administration. (2025, September 29). Restoring integrity to the issuance of non-domiciled commercial driver’s licenses (CDL). Federal Register.
https://www.federalregister.gov/documents/2025/09/29/2025-18869/restoring-integrity-to-the-issuance-of-non-domiciled-commercial-drivers-licenses-cdl - California Department of Motor Vehicles. (2026, March 6). Federal government requires California DMV to cancel certain nondomiciled drivers' licenses.
https://www.dmv.ca.gov/portal/news-and-media/federal-government-requires-california-dmv-to-cancel-certain-nondomiciled-drivers-licenses/
Chart Sources:
- U.S. Department of Agriculture, Agricultural Marketing Service. Agricultural Transportation Open Data Platform. https://agtransport.usda.gov/
- DAT Freight & Analytics. Reefer National Average Spot Rates. DAT Trendlines.
https://www.dat.com/trendlines/reefer/national-rates - ACT Research (2026, February 26). Class 8 truck orders: February 2026 update.
https://www.actresearch.net/resources/data-tracking/class-8-truck-orders - Cass Information Systems. (2026, February). Cass transportation index report: January 2026.
https://www.cassinfo.com/freight-audit-payment/cass-transportation-indexes/january-2026