.svg)

Executive Summary:
While Q1 usually brings a post-holiday lull, the 2026 reefer market faces distinct headwinds. Shippers need to shift from chasing capacity to securing higher-quality capacity in Q1 to navigate these critical factors:
- Regional Hotspots: Expect rate inflation in Texas, Florida, Arizona, and Northeast markets.
- The Price Floor: Plan for sustained rates rather than a crash, driven by high operating costs, tariffs, and a shrinking driver pool.
- The Strategic Pivot: Audit fleets for ELP and Non-Domiciled CDL compliance to prevent grounded loads.
- The February Collision: Secure committed capacity for Feb 3–14 before Super Bowl and Valentine’s demand depletes fleets.
Q1 Produce Volume and Reefer Capacity Overview: Interactive Charts
Regardless of the type of perishables you are shipping, produce movements drive reefer capacity and pricing within key regions. Analyzing these patterns provides a strong general indicator of market conditions. Use the interactive charts to explore how your region or commodity is affected.
*Data for all three charts is sourced from the U.S. Department of Agriculture Agricultural Marketing Service (USDA AMS). Values shown represent a four-year average of Q1 data to establish a seasonal baseline for regional volume, commodity volume, and truck availability. These visuals reflect typical market conditions. Actual volumes and capacity may vary based on weather, demand shifts, and logistical disruptions.*
6 Shifts to Watch in Q1 2026:
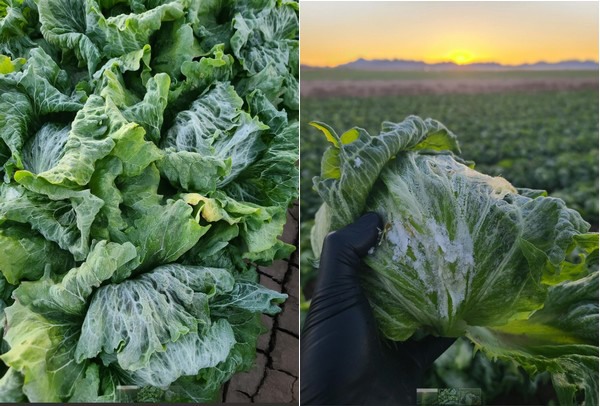
1. Winter Leafy Greens: Yuma & Imperial Valley
In Q1, Yuma and the Imperial Valley are the dominant source for leafy greens. This concentration of supply shapes reefer capacity, as carriers position fleets in the Southwest to cover winter demand.
- Production Monopoly: The region accounts for 90% of U.S. leafy greens production in winter, causing the national cold chain to rely entirely on this single zone [1].
- Volume Expansion: Demand is surging; Q1 2025 data recorded an 88% year-over-year increase in Arizona’s refrigerated volume (1.28 million tons), driven by processed lettuce [1].
- Watch Out: A single freeze event can disrupt harvest schedules nationwide, causing immediate capacity deficits as shippers scramble to recover orders [2].
Takeaway: Prioritize carriers with established networks in Yuma and Calexico to mitigate deadhead premiums and secure capacity during the peak harvest window.
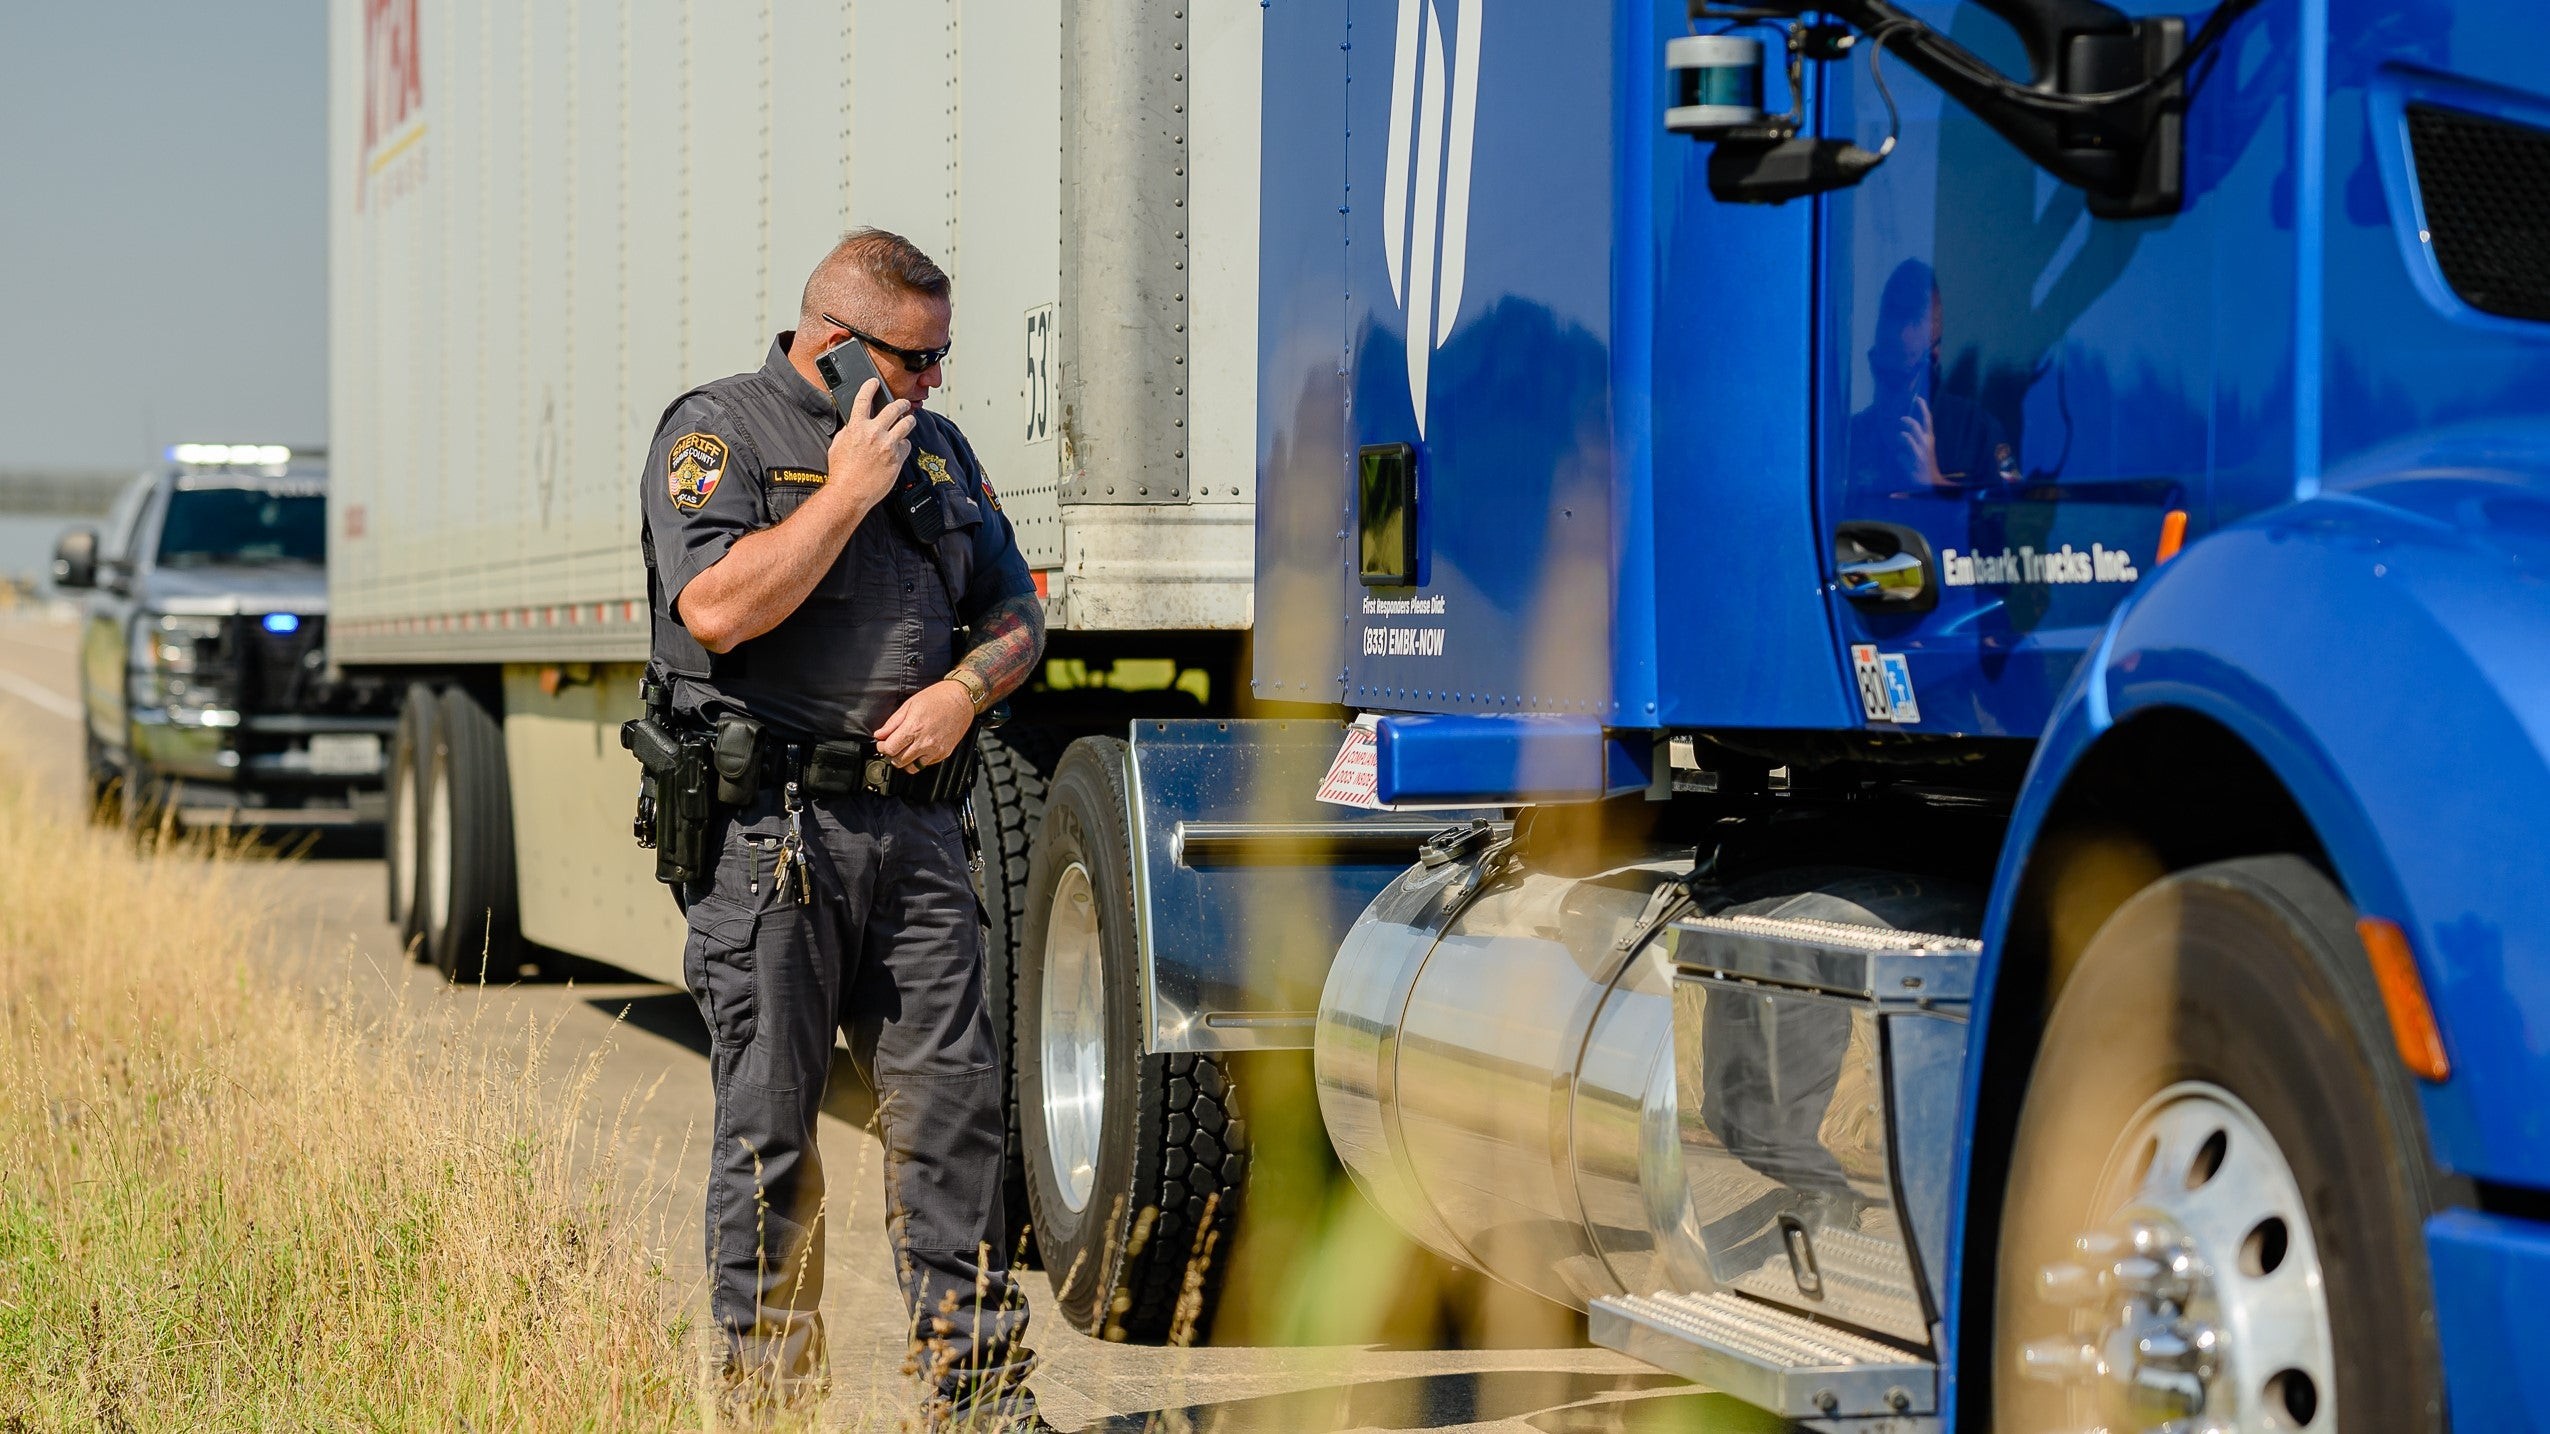
2. Regulatory Friction: The ELP Crackdown
Although the initial volatility of English Language Proficiency (ELP) enforcement has settled, it remains a tangible risk following the June 2025 reclassification. The FMCSA and state partners have maintained focused roadside checks, specifically threatening cross-border runs, long-haul team freight, and lanes passing through high enforcement states.
- Immediate Risk (OOS): The specific ELP violation code (391.11B2-Q) has emerged as a top driver violation for trucks operating outside of commercial zones, accumulating 11,713 citations between January and October 2025, with over 5,000 of those drivers being immediately placed Out-of-Service (OOS) [3].
- Structural Capacity Loss: The FMCSA estimates that the new non-domiciled CDL rules will lead to 194,000 non-domiciled CDL holders and 20,000 CLP holders exiting the market upon credential renewal, representing a permanent loss from the long-haul driver pool [4].
Takeaway:
To secure stable capacity amid structural driver loss and ELP enforcement risk, shippers should audit carrier compliance closely to avoid loads being grounded in transit.
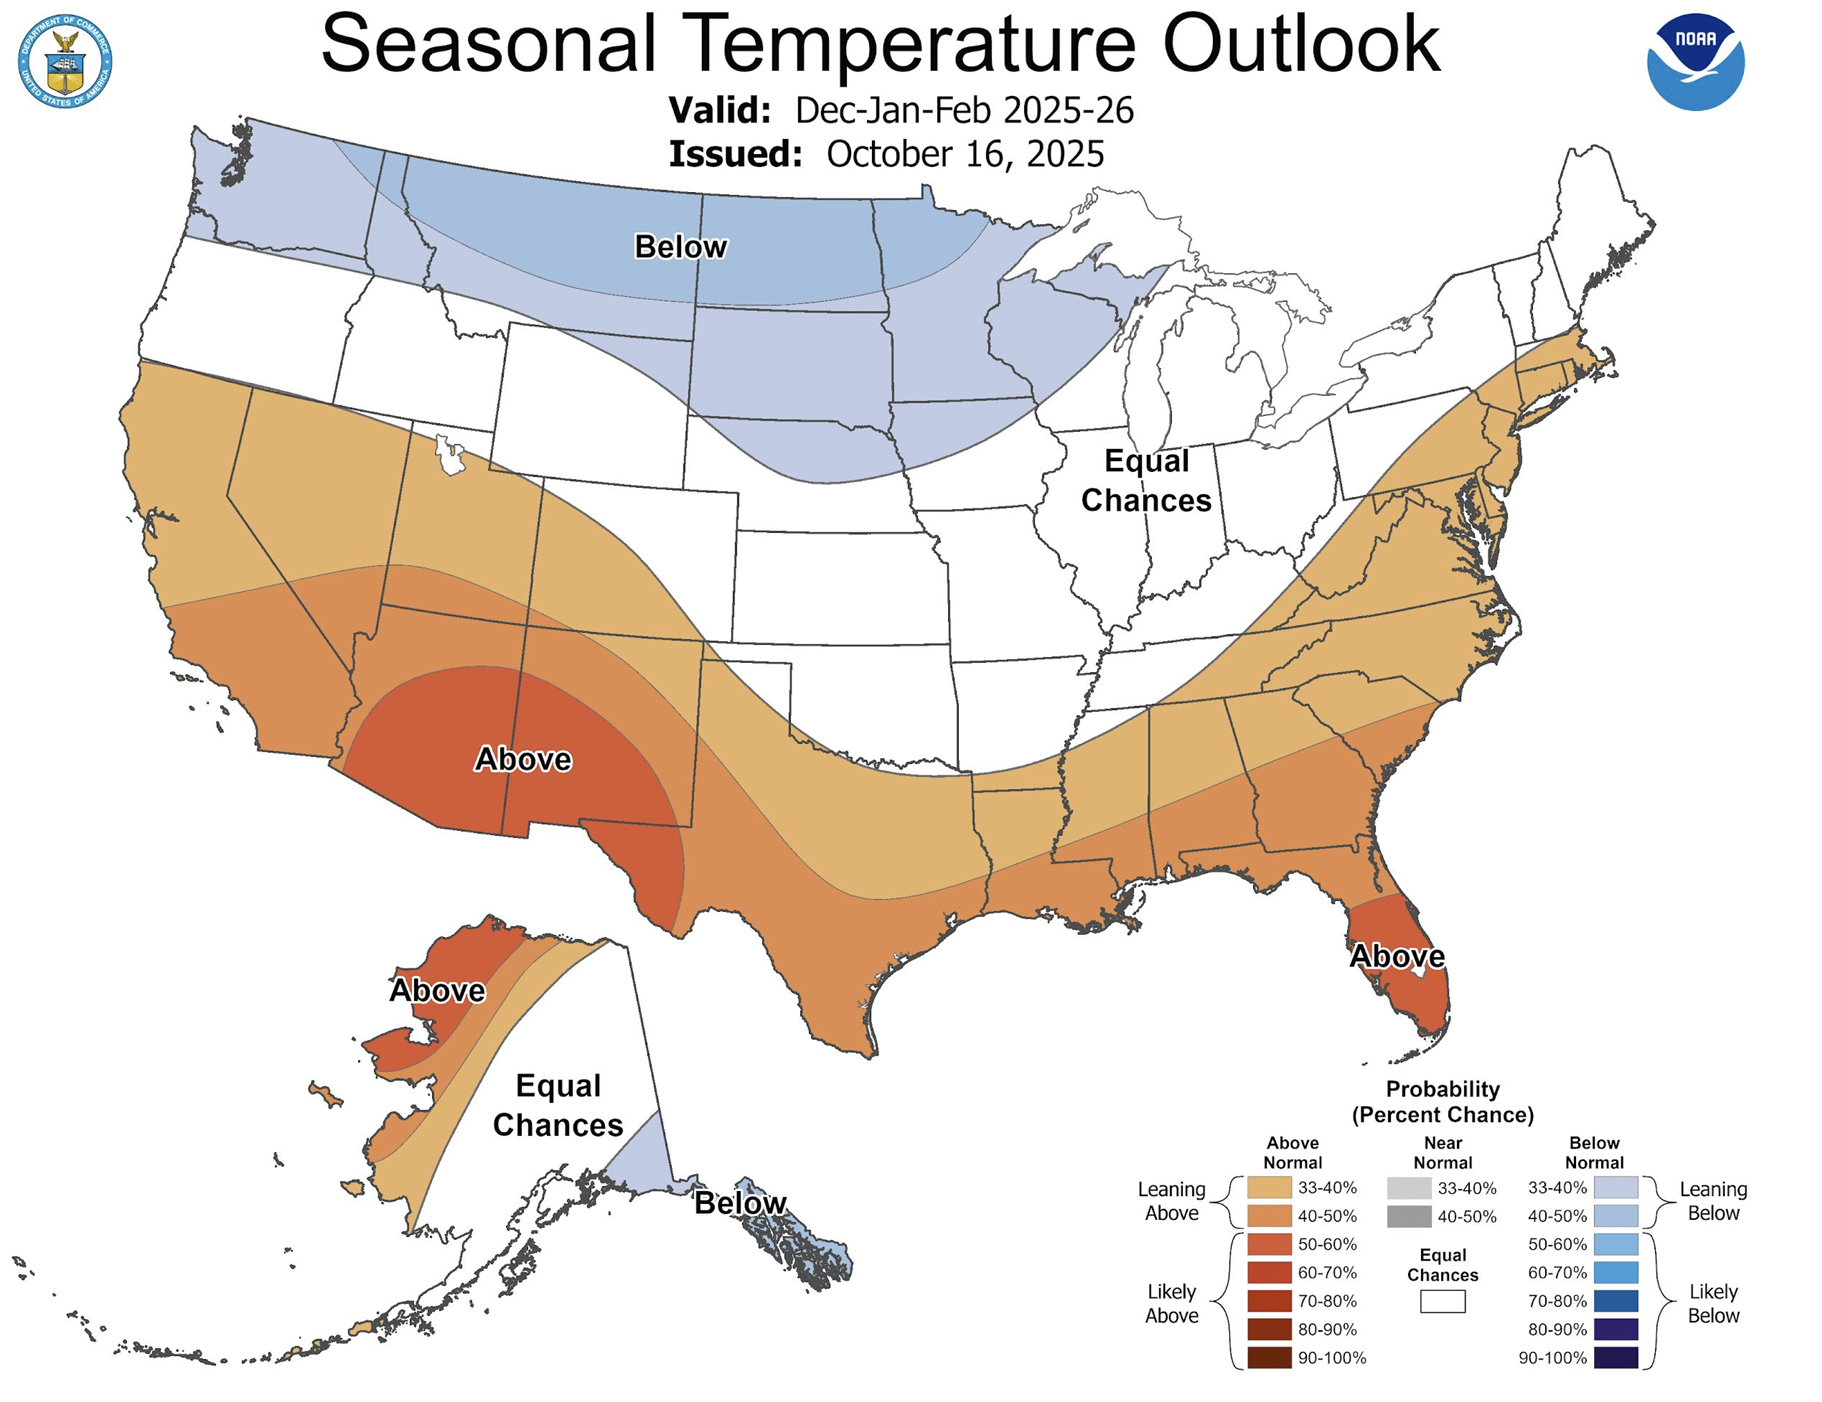
3. Seasonal Weather Volatility: The "Ice & Isolation" Factor
Q1 capacity is defined by equipment capability and positioning, both of which are threatened by the forecast for a La Niña winter. Shippers must account for the risk of "dislocated" capacity, trucks stranded in the North due to weather, and the absolute necessity of "Protect From Freezing" (PFF) service.
- The Reality: NOAA's Winter 2025-2026 Outlook predicts a classic La Niña pattern, favoring colder-than-average temperatures and wetter conditions across the Northern Plains and Pacific Northwest [5].
- PFF Requirement: With "elevated probabilities" of below-normal temperatures forecast for the Upper Midwest, standard reefer insulation will be insufficient; active heat cycles will be mandatory to prevent product loss [6].
- Dislocation Risk: Heavy precipitation forecast for the Great Lakes and Ohio Valley increases the likelihood of equipment being stranded in these consumption markets, preventing trucks from returning to the southern produce zones [6].
Takeaway: Audit your carrier network for PFF capabilities immediately and build in extra lead time for equipment repositioning from the Midwest and Pacific Northwest. Shippers should also prepare to shift standard dry van lanes to reefer units to mitigate freeze risks.
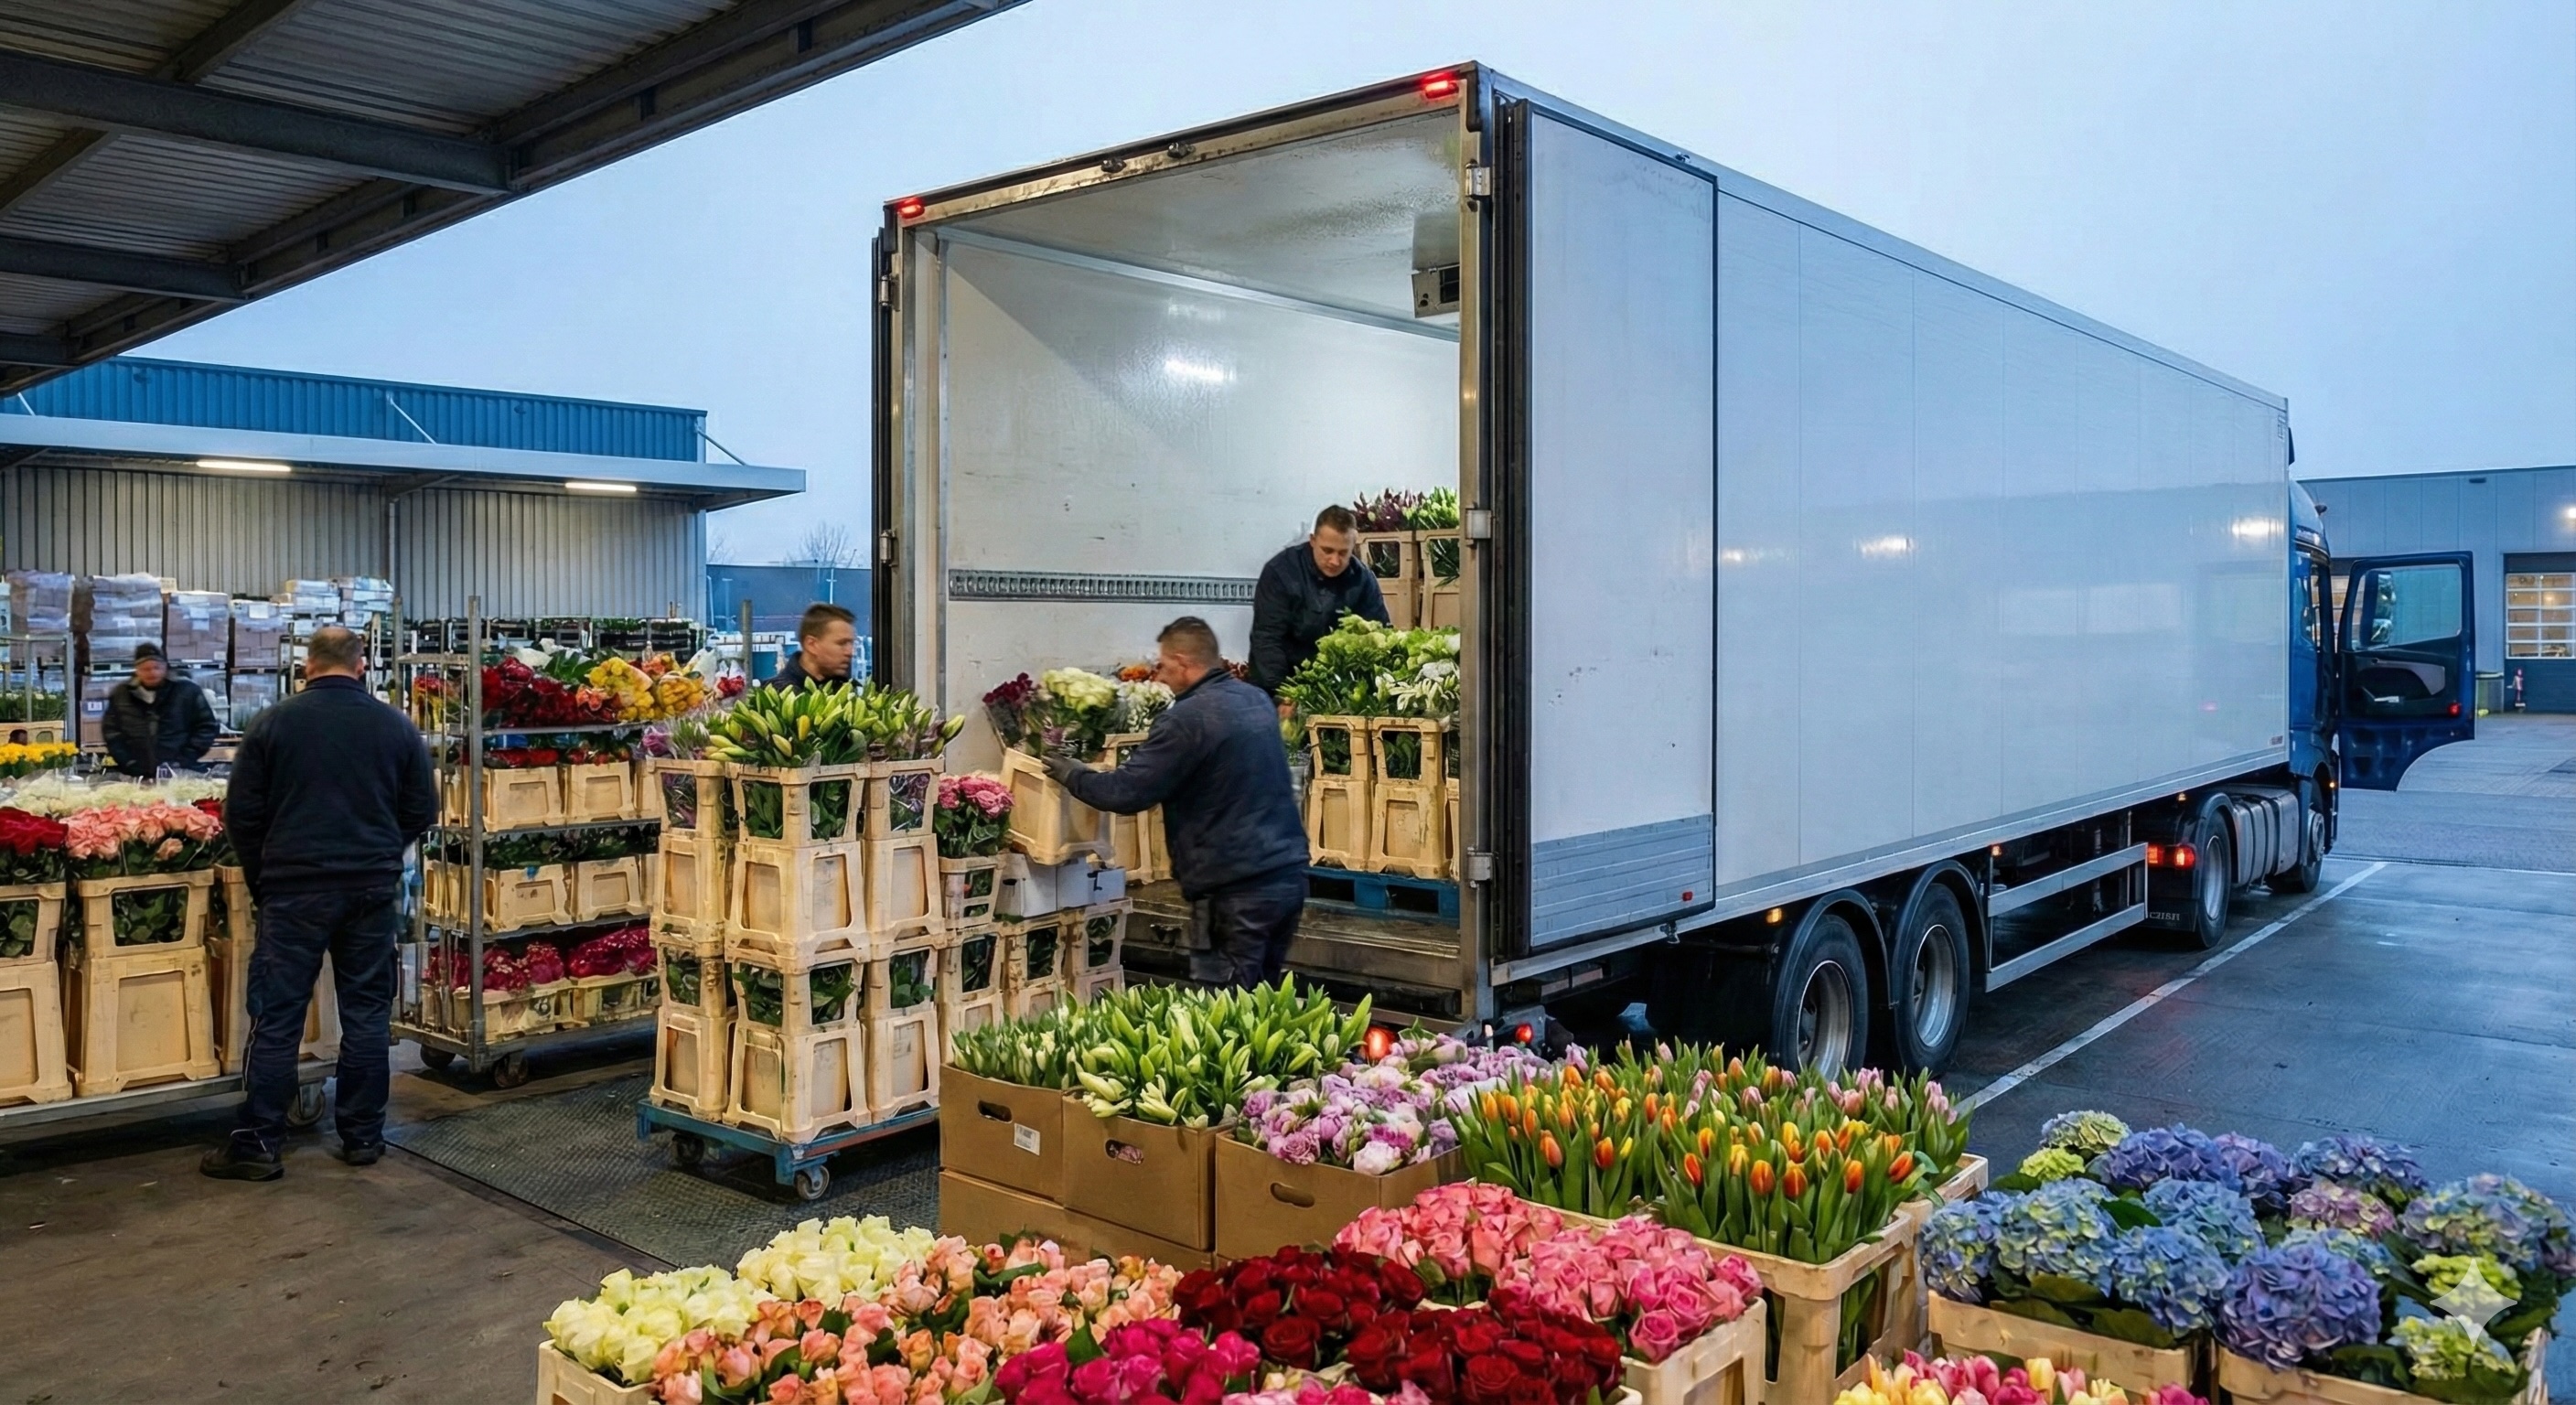
4. Import Season Activation: Texas Border & Northeast Ports
As domestic production bottoms out in Q1, capacity is drained on two fronts: Northeast ports for South American fruit and the Southwest border for Mexican produce.
- Southwest Border: Mexico is the dominant force in Q1, with confirmed truck shipments hitting 3.51 million tons in Q1 2025 (41% of all U.S. produce volume) [1]. This isn't just bulk vegetables; high-value berry exports are tracking to hit 752,000 tons this year, a 5% increase that demands team-driven, high-service capacity in Texas and Arizona [7].
- Northeast: Delaware River ports monopolize regional capacity during the winter. Peruvian grape exports are forecast to jump 12% to a record 770,000 tons for the 2025/26 season [8]. Simultaneously, Chilean blueberry exports are continuing to rebound, with a 1% gain expected this season following a recovery that ended four consecutive seasons of losses. [9].
Takeaway: High-value loads like berries, avocados, and grapes set the market. Their premiums pull fleets toward the Northeast and Southwest, redirecting capacity. So, if you are not shipping them you are competing with carriers chasing the “fruit premium.”
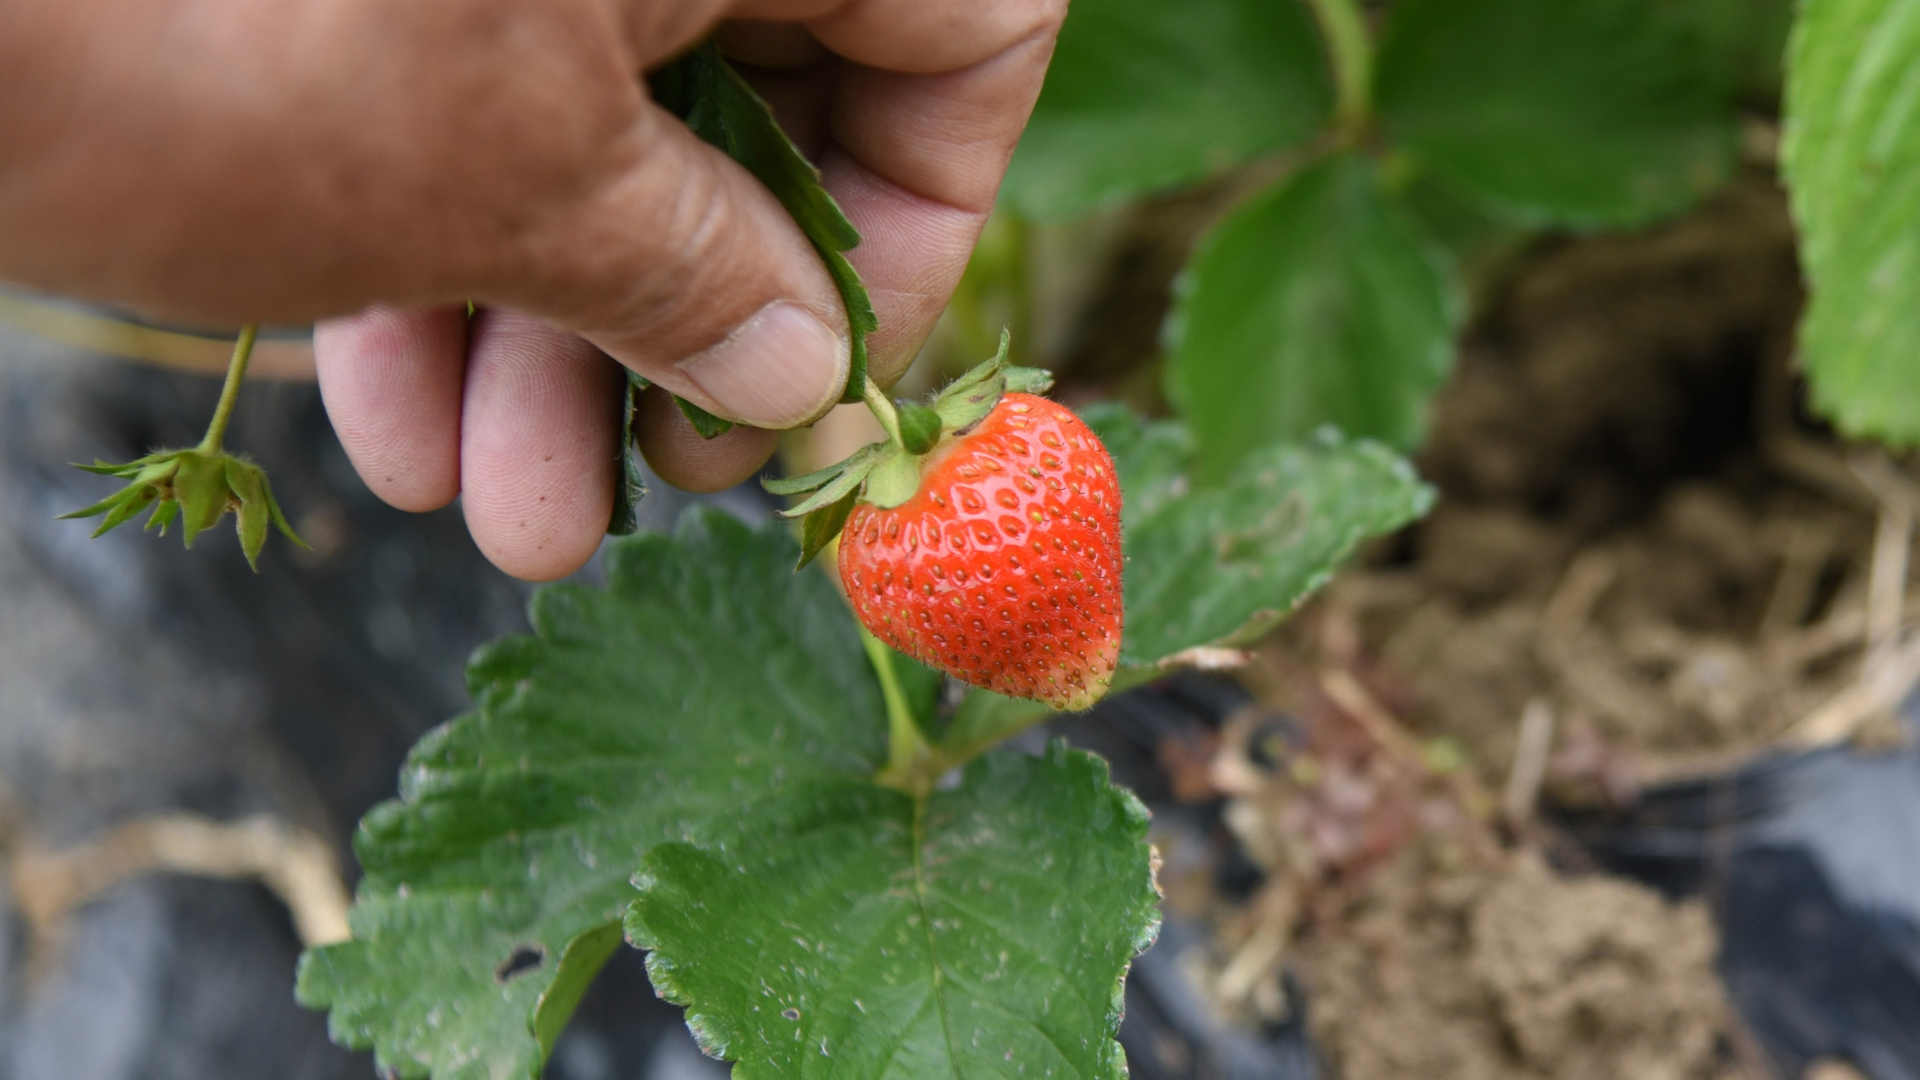
5. More on Berries: California, Mexico, and Florida
Strawberries are market drivers. When one major growing region falters, procurement immediately pivots to the other, creating a "whiplash" effect for logistics networks. The 2023 season serves as the cautionary baseline: severe La Niña storms caused nearly $200 million in crop losses in California, forcing an aggressive shift to other markets to sustain retail shelves [10].
2025/26 Harvest Outlook:
- California (Delays): While acreage has hit a record high of 42,885 acres (+1.3% YoY), early reports indicate "phenological delays" of up to 3 weeks due to cooler inland weather [11][12].
- Mexico (Gap Filler): To cover potential domestic shortfalls, Mexican production is forecast to grow 6% this season, targeting 700,000 metric tons [13].
- Florida (Surge): Florida growers report a "robust" crop entering Q1. The adoption of high-yield varieties like Ember and Encore has expanded significantly (up ~400% in planted acreage), positioning the Southeast to capture volume if the West Coast lags [14].
Takeaway: Volume is not disappearing; it is displacing. With California facing early maturity delays, the "Fruit Premium" on spot rates will likely emerge first in South Texas (McAllen/Pharr) and Central Florida rather than the West Coast. Carriers will chase this yield, so if you are shipping out of the Southeast in Q1, expect to compete directly with berry harvests for reefer capacity.
6. The February Collision: Super Bowl vs. Valentine’s Day
The first two weeks of February represent a "capacity cliff" where two massive logistics events—Valentine’s Day and the Super Bowl—collide. This creates a temporary but severe distortion in the refrigerated freight market, stripping team capacity from general networks.
- The Event: Miami International Airport processes approximately 90% of all fresh-cut flowers imported to the U.S., handling over 1 billion stems in the weeks leading up to Valentine's Day [15].
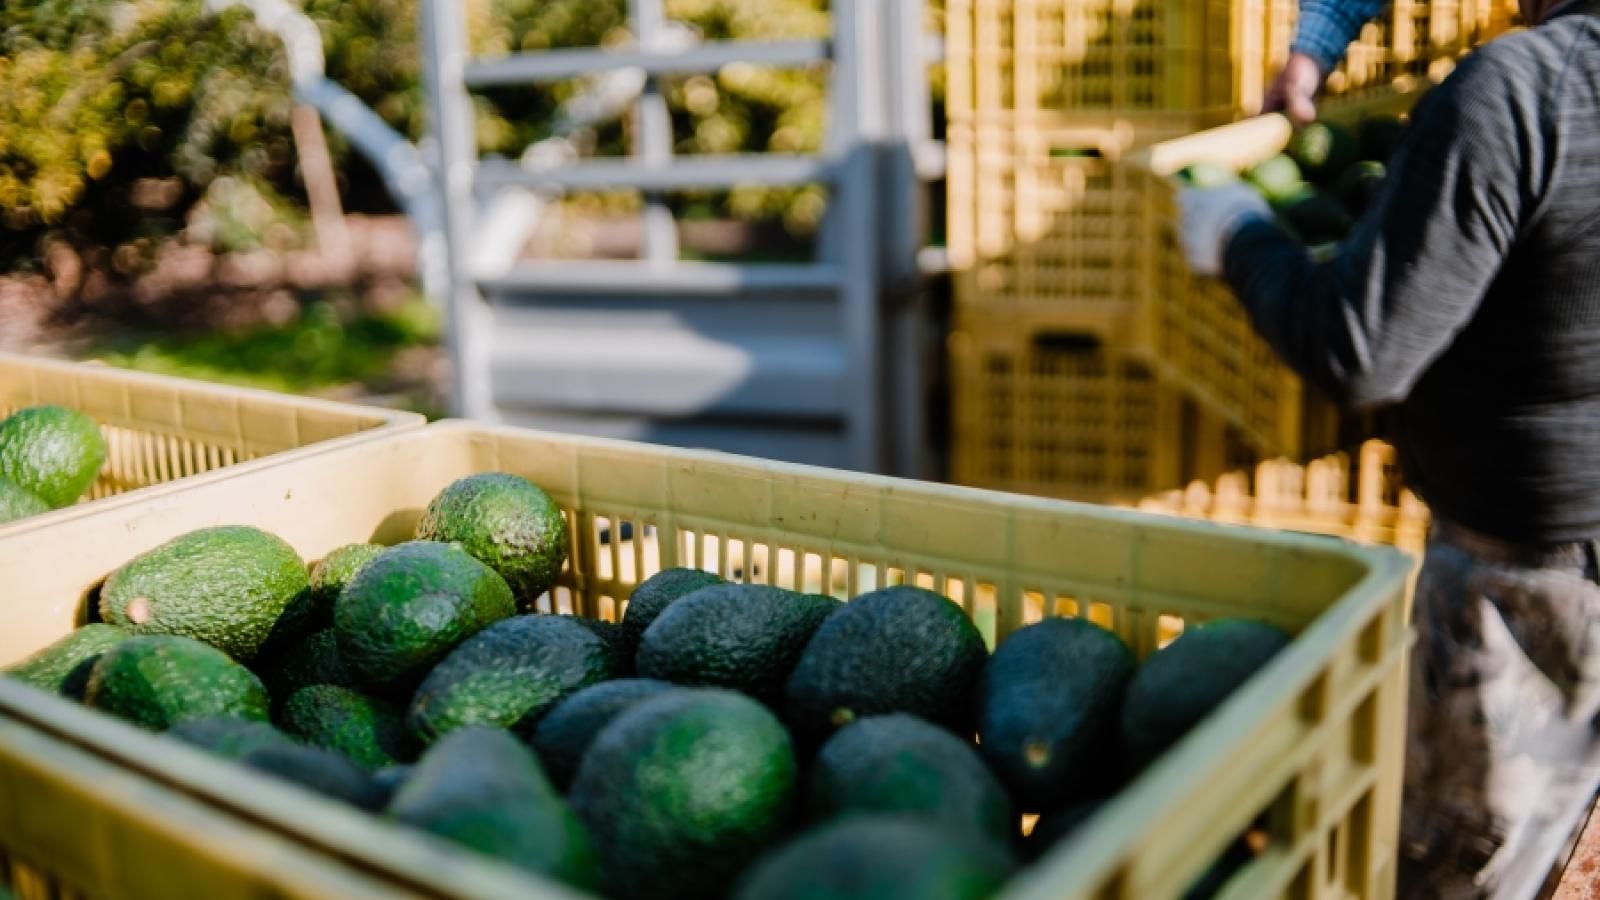
- The Numbers: Simultaneously, avocado imports for the Super Bowl peak; Q1 2025 saw 308,000 tons of avocados cross the border, creating a massive parallel demand for reefer trucks [1].
- The Squeeze: The floral surge drains Miami’s outbound capacity, while peak avocado imports strain Texas border crossings. Together they create acute reefer shortages and intense competition for coverage.
Takeaway: Treat Feb 3–14 as a "blackout period" for spot market reliance; secure committed capacity for this window well in advance to avoid paying premium surge rates
Macro Context: Why Reefer Rates Won’t Crash
While Q1 is typically a soft season, three structural forces prevent refrigerated rates from dropping to historical lows:
- The "Team" Deficit (Demographics): The "Silver Tsunami" hits the cold chain hardest. Older drivers (avg. age 47) overwhelmingly prefer solo, local routes. As they retire, they are not being replaced by new team drivers due to ELDT bottlenecks & ELP compliance, creating an increasing shortage of the expedited team capacity required for long-haul perishables [16].
- The "Compliance" Squeeze: Federal regulators are revoking accreditation for thousands of noncompliant CDL schools, putting more than 40 percent of providers under review [17]. While this improves safety by removing low-quality training programs, it also slows the influx of cheaper, undertrained drivers, creating a risk of slower CDL issuance and tighter capacity.
- The Reefer Premium: The cost to operate a reefer unit is trending upward. With 25% tariffs on cross-border equipment and parts taking effect in late 2025, carriers face soaring capital costs for reefer units [18].
National Market Overview:
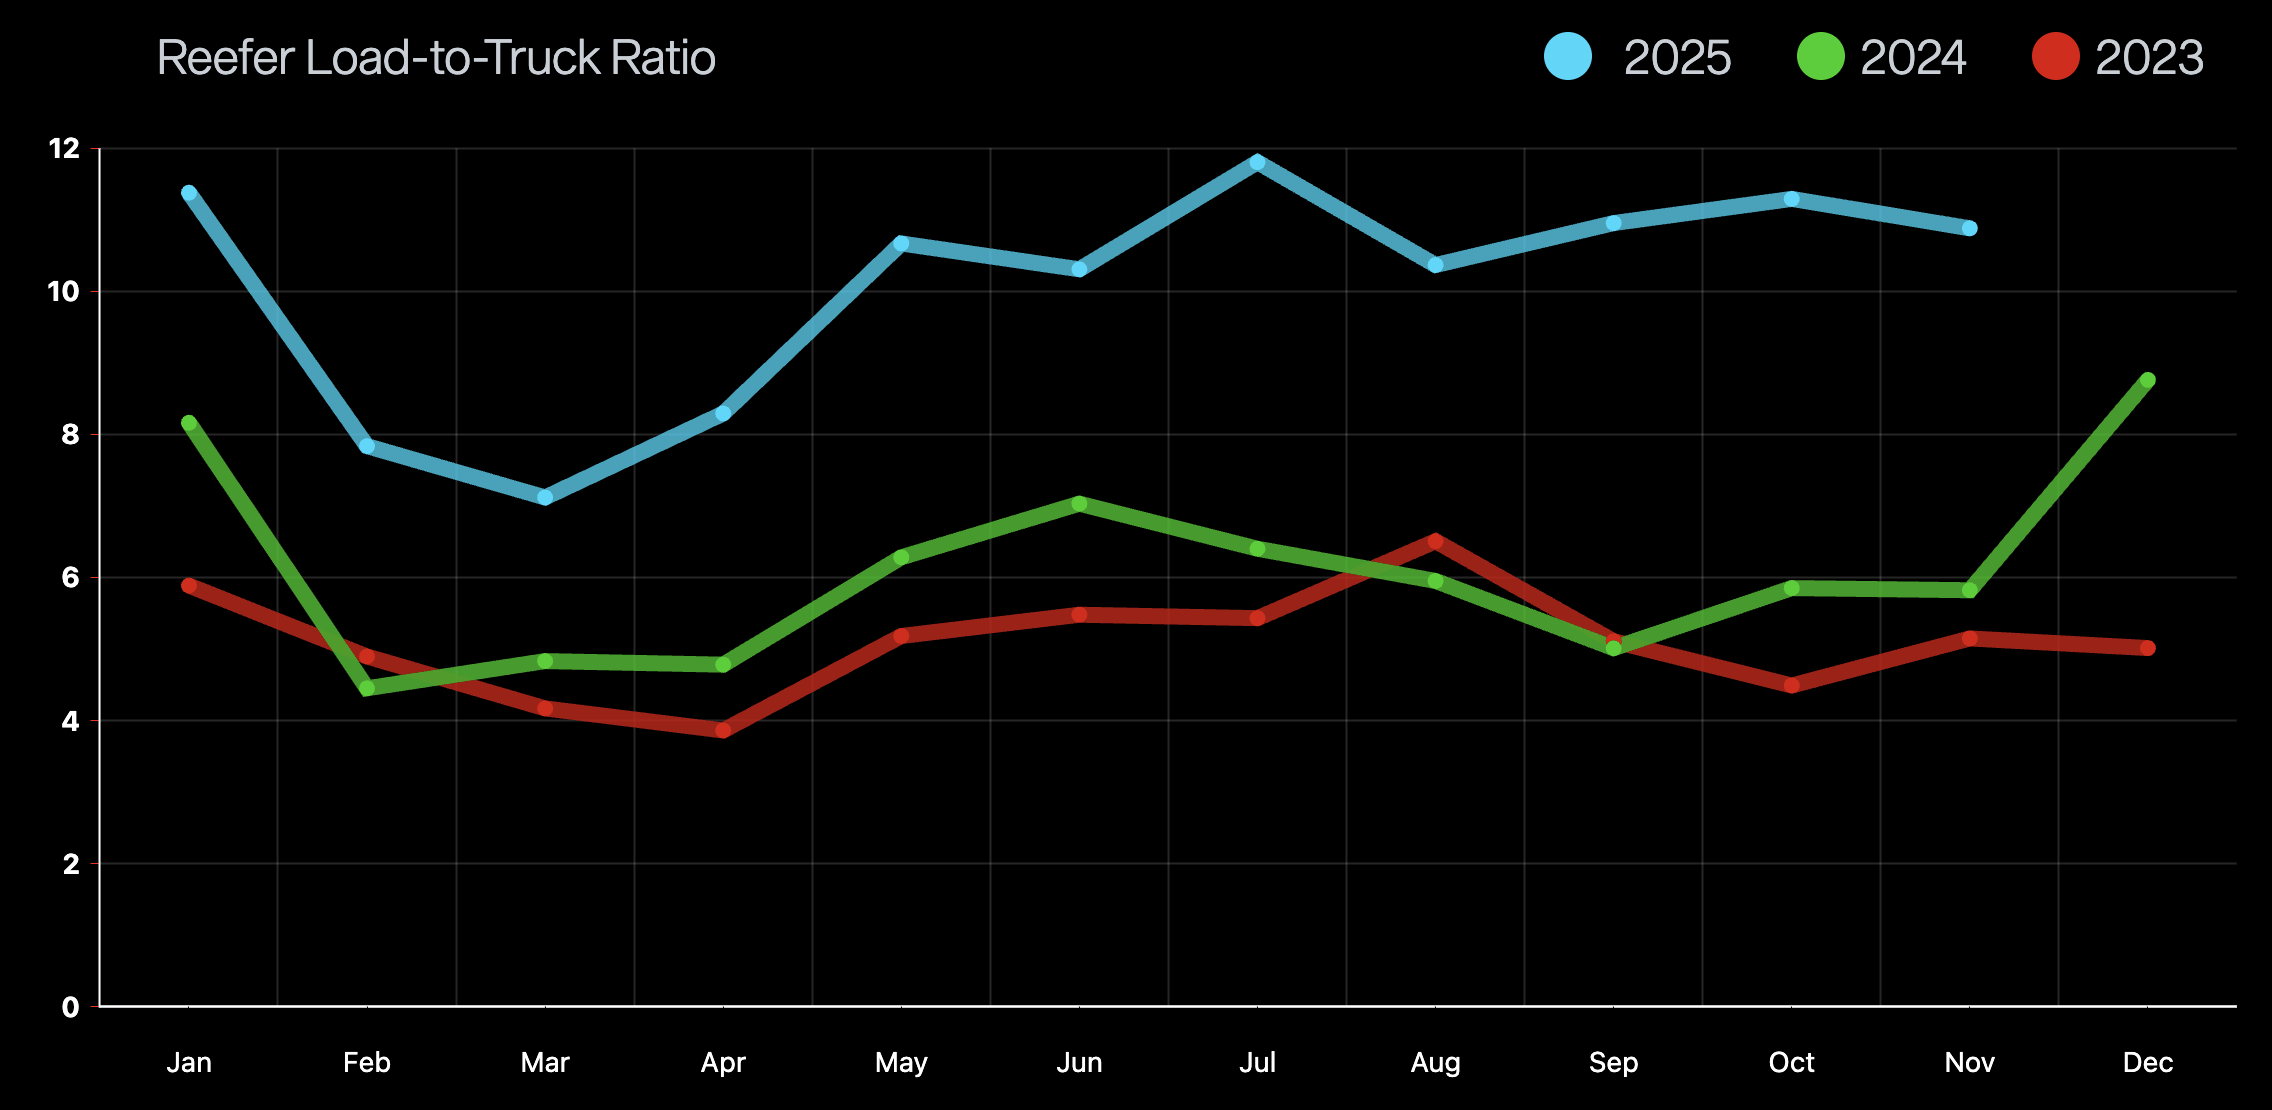
Takeaway: Reefer load-to-truck ratios drop off sharply after February, a pattern that has held consistently across the past three years, signaling easing capacity pressure as Q1 progresses.
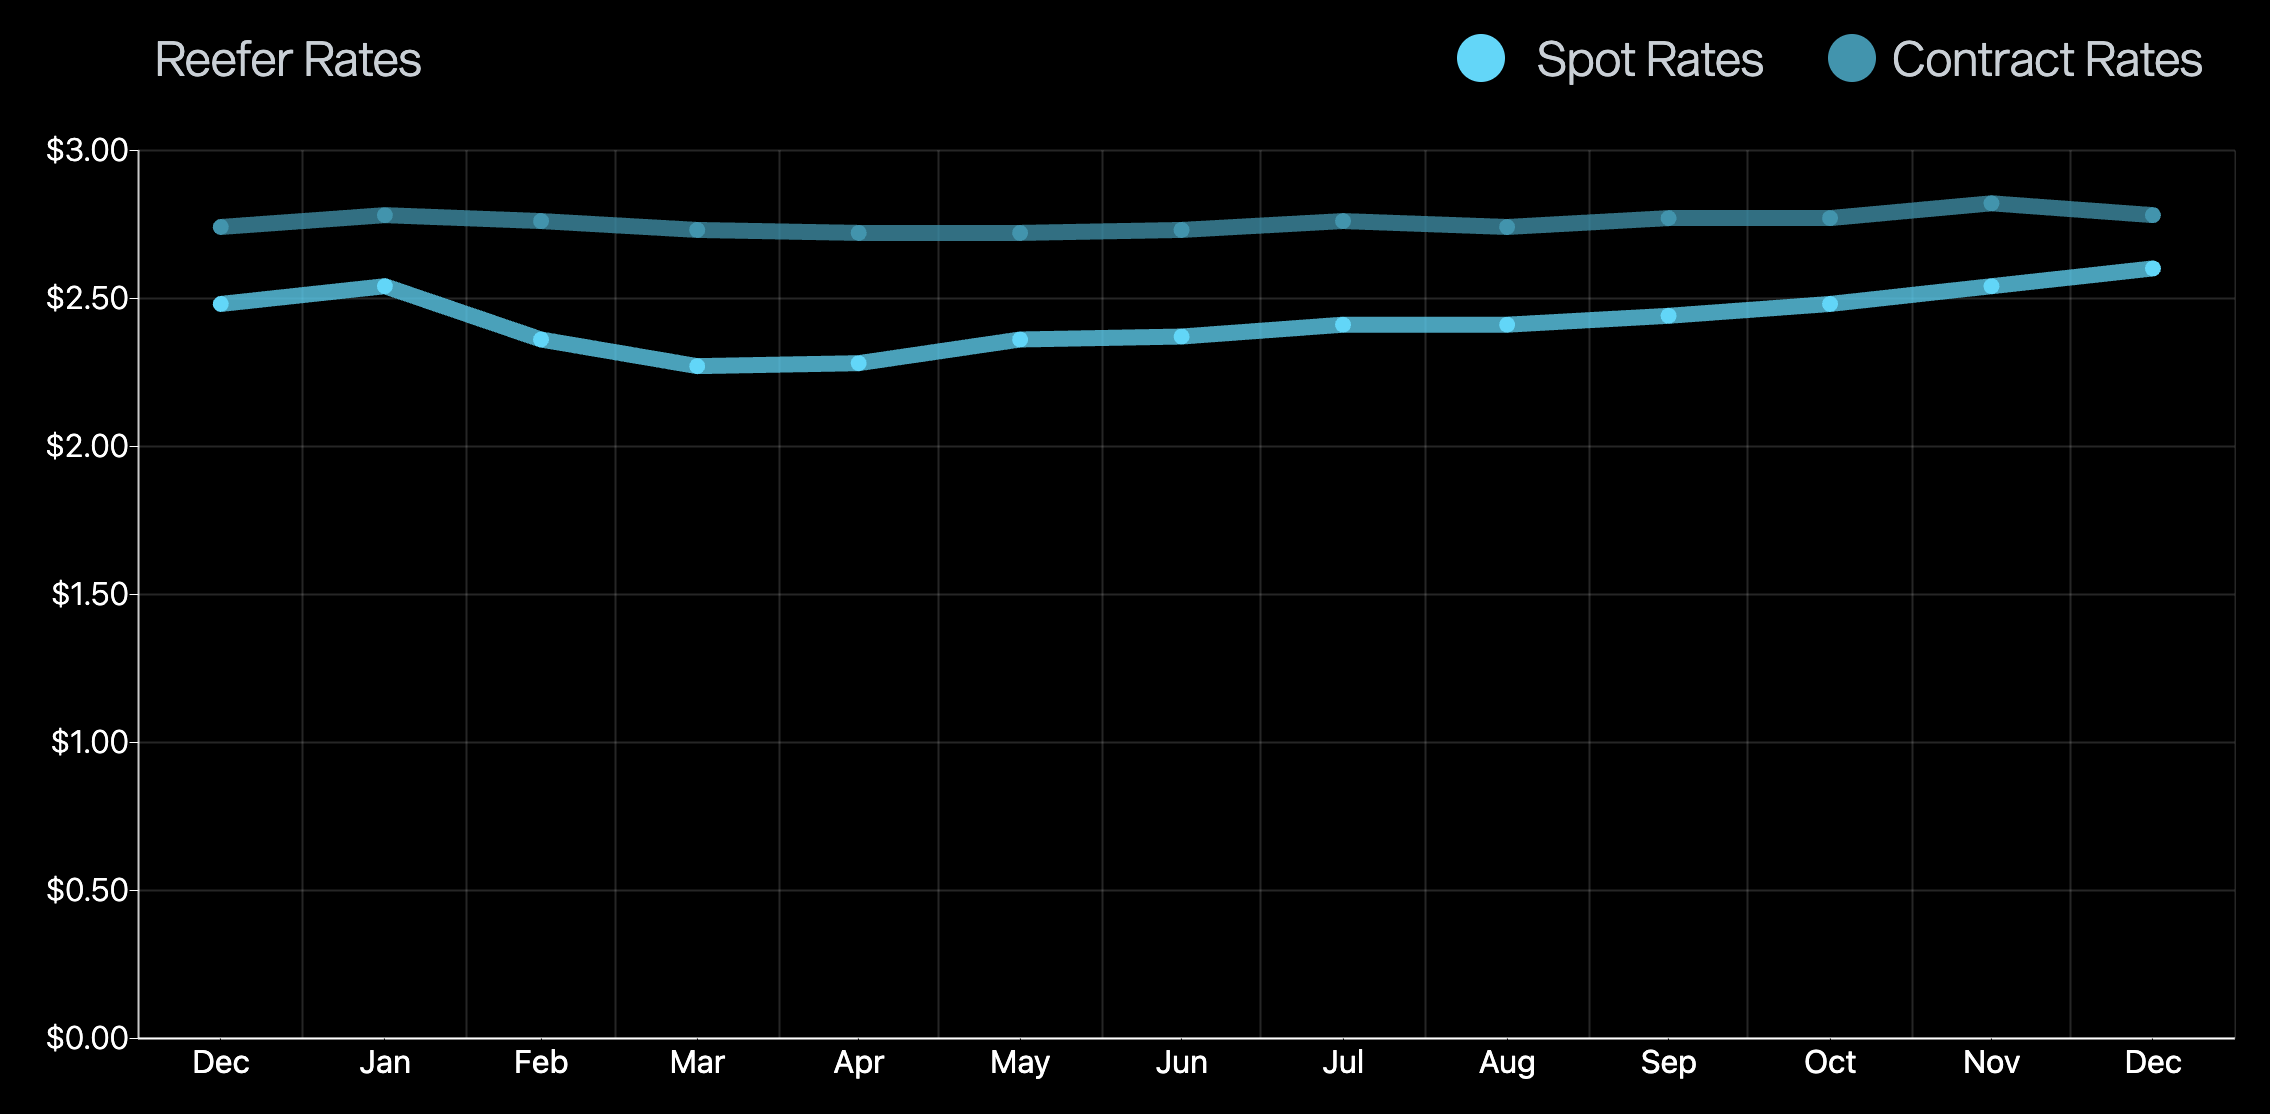
Takeaway: Spot and contract pricing typically remain tightly aligned through early February, making contracted capacity the most cost-stable strategy early in Q1. The gap between spot and contract is narrowing; if the trend holds, rates could equalize, leaving spot freight with no price advantage to offset its volatility.
Shipper Playbook: Q1 2026
The latest Logistics Managers' Index (LMI) confirms the market has signaled a decisive end to the prolonged freight slump. Crucially, the combination of historically low retailer inventories and actively rising transportation prices guarantees a massive restocking wave will collide with the Q1 capacity squeeze [19].
Weeks 1–3: The Audit Phase (Jan 1 – Jan 21)
- Market Status: False calm. Volume is low, but carrier operating costs prevent rate collapses.
- Executive Action: Run "Protect from Freezing" (PFF) and ELP compliance audits now. If a carrier can't prove they have heaters or English-proficient drivers, remove them before the February pressure test.
Weeks 4–5: The Ramp Up (Jan 22 – Feb 4)
- Market Status: The "Texas Triangle" heats up. Super Bowl avocado imports peak while Valentine’s floral staging begins.
- Executive Action: Move all non-essential dry freight out of border zones (Laredo/McAllen) immediately. You cannot compete with avocado premiums during this window.
Weeks 6–7: The "Capacity Blackout" (Feb 5 – Feb 18)
- Market Status: Super Bowl and Valentine’s Day collide. Team capacity disappears from the general market to haul flowers.
- Executive Action: Do not rely on spot markets. If you didn't pre-book, pay the premium immediately. Rates will only go up.
Weeks 8–13: The Stabilization (Feb 19 – Mar 31)
- Market Status: Floral surge ends; Yuma produce remains high.
- Executive Action: Protect the Floor. As rates soften, do not push partners below their break-even cost. Paying pennies above the floor now acts as an insurance policy to maintain quality carriers going into Q2.
Lane Collaboration Opportunities:
- Our origin footprint is especially dense across key produce regions: California (Salinas, Central Valley, desert), Arizona, the Pacific Northwest, and Texas, giving shippers strong coverage out of the fields and allowing us to service those lanes with ease through an established carrier network.
- If you are shipping outbound from Colorado, Atlanta and the broader Southeast, Florida, South Carolina, Washington / Northern Virginia, or Philadelphia, our network alignment in these markets creates cost-efficient outbound opportunities and reliable backhaul capacity to growing regions.
To plug your lanes into our network or request a quote, reach out to sales@freshfreight.com.
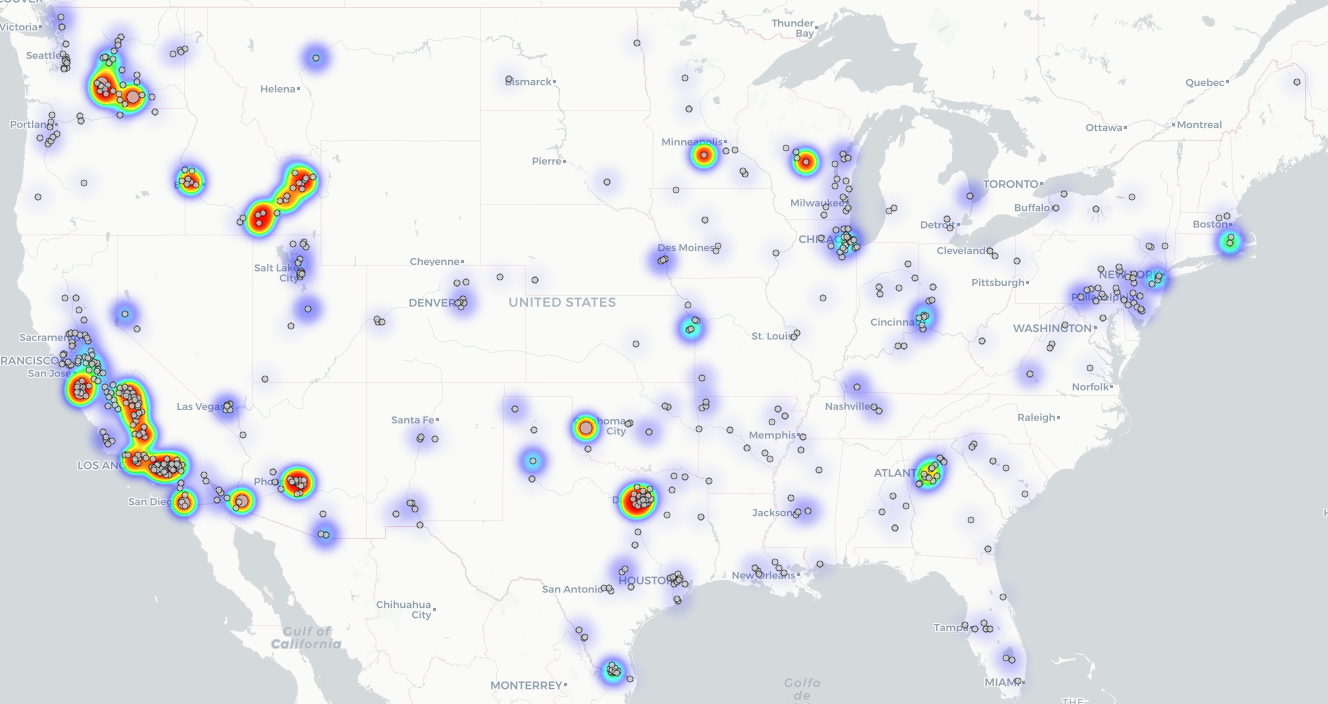
Fresh Freight Origin Heatmap (Last 90 Days):
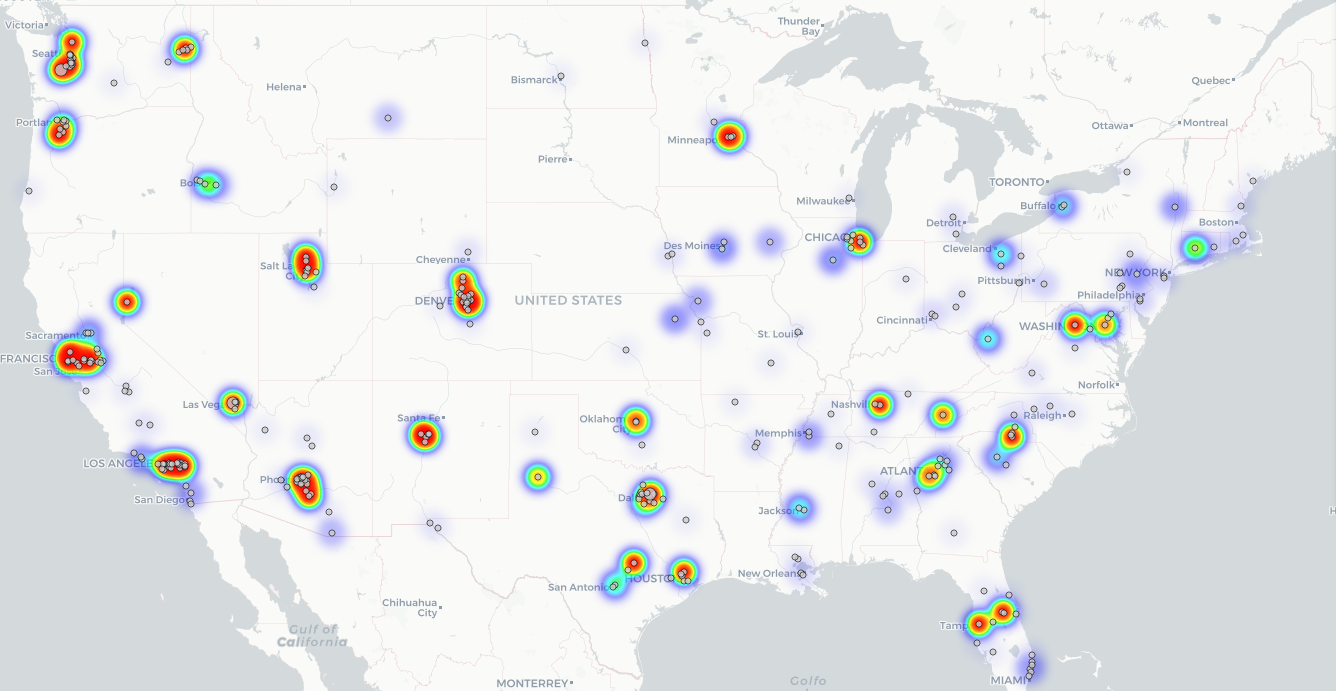
Fresh Freight Destination Heat Map (Last 90 Days):
Sources & References:
- U.S. Department of Agriculture, Agricultural Marketing Service.
Agricultural Refrigerated Truck Quarterly Report (2025). https://www.ams.usda.gov/sites/default/files/media/RTQ1stQuarter2025.pdf-
- Climate Assessment for the Southwest (CLIMAS).
Recent Freeze Events in Arizona Agriculture. https://www.federalregister.gov/documents/2025/09/29/2025-18869/restoring-integrity-to-the-issuance-of-non-domiciled-commercial-drivers-licenses-cdl
- Federal Register
Restoring Integrity to the Issuance of Non-Domiciled Commercial Driver’s Licenses (CDL). https://www.federalregister.gov/documents/2025/09/29/2025-18869/restoring-integrity-to-the-issuance-of-non-domiciled-commercial-drivers-licenses-cdl
- Federal Motor Carrier Safety Administration (FMCSA).
Inspection and Enforcement Visualization Tool.
https://ai.fmcsa.dot.gov/EnforcementPrograms/Inspections/Visualization
- NOAA Climate Prediction Center.
90-Day Climate Outlook.
https://www.cpc.ncep.noaa.gov/products/predictions/90day/fxus05.html
- National Weather Service.
2025–2026 Winter Outlook.
https://www.weather.gov/media/abr/sitreport/2025-2026WinterOutlook.pdf
- U.S. Department of Agriculture, Foreign Agricultural Service.
Berry Annual (Voluntary), Guadalajara, Mexico (2025)
https://apps.fas.usda.gov/newgainapi/api/Report/DownloadReportByFileName?fileName=Berry%20Annual%20Voluntary_Guadalajara_Mexico_MX2025-0005.pdf
- U.S. Department of Agriculture, Foreign Agricultural Service.
Fresh Deciduous Fruit Annual, Lima, Peru (2025).
https://apps.fas.usda.gov/newgainapi/api/Report/DownloadReportByFileName?fileName=Fresh%20Deciduous%20Fruit%20Annual_Lima_Peru_PE2025-0027.pdf
- Blueberries Consulting.
Replacement varieties drive growth: Chile’s Blueberry Fruit Committee projects a slight increase in fresh blueberry exports for the 2025–2026 season (2025).
https://blueberriesconsulting.com/en/variedades-de-recambio-impulsan-alza-comite-de-arandanos-de-frutas-de-chile-proyecta-leve-incremento-en-las-exportaciones-de-arandanos-frescos-para-la-temporada-2025-2026/
- FreshFruitPortal.com.
California strawberry industry rain damages approach US$200M (2023). https://www.freshfruitportal.com/news/2023/01/23/california-strawberry-industry-rain-damages-approach-us200m/
- AgInfo.net.
California Strawberry Acreage Hits New Records for 2025. https://www.aginfo.net/report/63452/California-Ag-Today/California-Strawberry-Acreage-Hits-New-Records-for-2025
- FreshPlaza.com.
“Despite the phenological delay, we are starting the strawberry harvest with good market forecasts.” (2025).
https://www.freshplaza.com/north-america/article/9791308/despite-the-phenological-delay-we-are-starting-the-strawberry-harvest-with-good-market-forecasts/
- U.S. Department of Agriculture, Foreign Agricultural Service.
Berry Annual (Voluntary). GAIN Report MX2025-0005. (2025). https://apps.fas.usda.gov/newgainapi/api/Report/DownloadReportByFileName?fileName=Berry%20Annual%20Voluntary_Guadalajara_Mexico_MX2025-0005.pdf
- University of Florida, IFAS Communications.
Florida Strawberry Season Bursts with Sweetness (2025). https://blogs.ifas.ufl.edu/news/2025/12/03/florida-strawberry-season-bursts-with-sweetness/
- U.S. Customs and Border Protection.
No Love for Pests: CBP Valentine’s Day Agriculture Interceptions. https://www.cbp.gov/newsroom/national-media-release/no-love-pests-cbp-valentine-s-day
- American Transportation Research Institute (ATRI).
Evolving Truck Driver Demographics: Issues and Opportunities (2025). https://truckingresearch.org/2025/07/evolving-truck-driver-demographics-issues-and-opportunities/
- NPR
DOT Crackdown Could Shut Down Thousands of CDL Trucking Schools.
https://www.npr.org/2025/12/01/nx-s1-5627474/cdl-trucking-schools-dot-crackdown
- The White House.
Adjusting Imports of Medium and Heavy-Duty Vehicles, Parts, and Buses into the United States (2025).
https://www.whitehouse.gov/presidential-actions/2025/10/adjusting-imports-of-medium-and-heavy-duty-vehicles-medium-and-heavy-duty-vehicle-parts-and-buses-into-the-united-states/
- Logistics Managers Index (LMI).
November 2025 Report.
https://www.the-lmi.com/november-2025-logistics-managers-index.html
Chart Data:
- DAT Freight & Analytics.
Reefer Demand and Capacity – Load-to-Truck Ratio. DAT Trendlines.
https://www.dat.com/trendlines/reefer/demand-and-capacity
- DAT Freight & Analytics.
Reefer National Average Spot Rates. DAT Trendlines. https://www.dat.com/trendlines/reefer/national-rates
- U.S. Department of Agriculture, Agricultural Marketing Service.
Agricultural Transportation Open Data Platform.
https://agtransport.usda.gov/